Mini Chapter Eleven
Bull Spread
- Generally structured as buying a lower strike (base case at the money) call and selling a higher strike (out of the money) call for the same expiry and same notionals.
- As the name suggests this is a bullish expression on the underlying but also limits profits as one cheapens the option by doing a spread versus buying an outright call. A more bullish view on the underlying is expressed by buying an out of the money (instead of ATM) higher strike call which would have more leverage on the underlying in case of a big move higher.
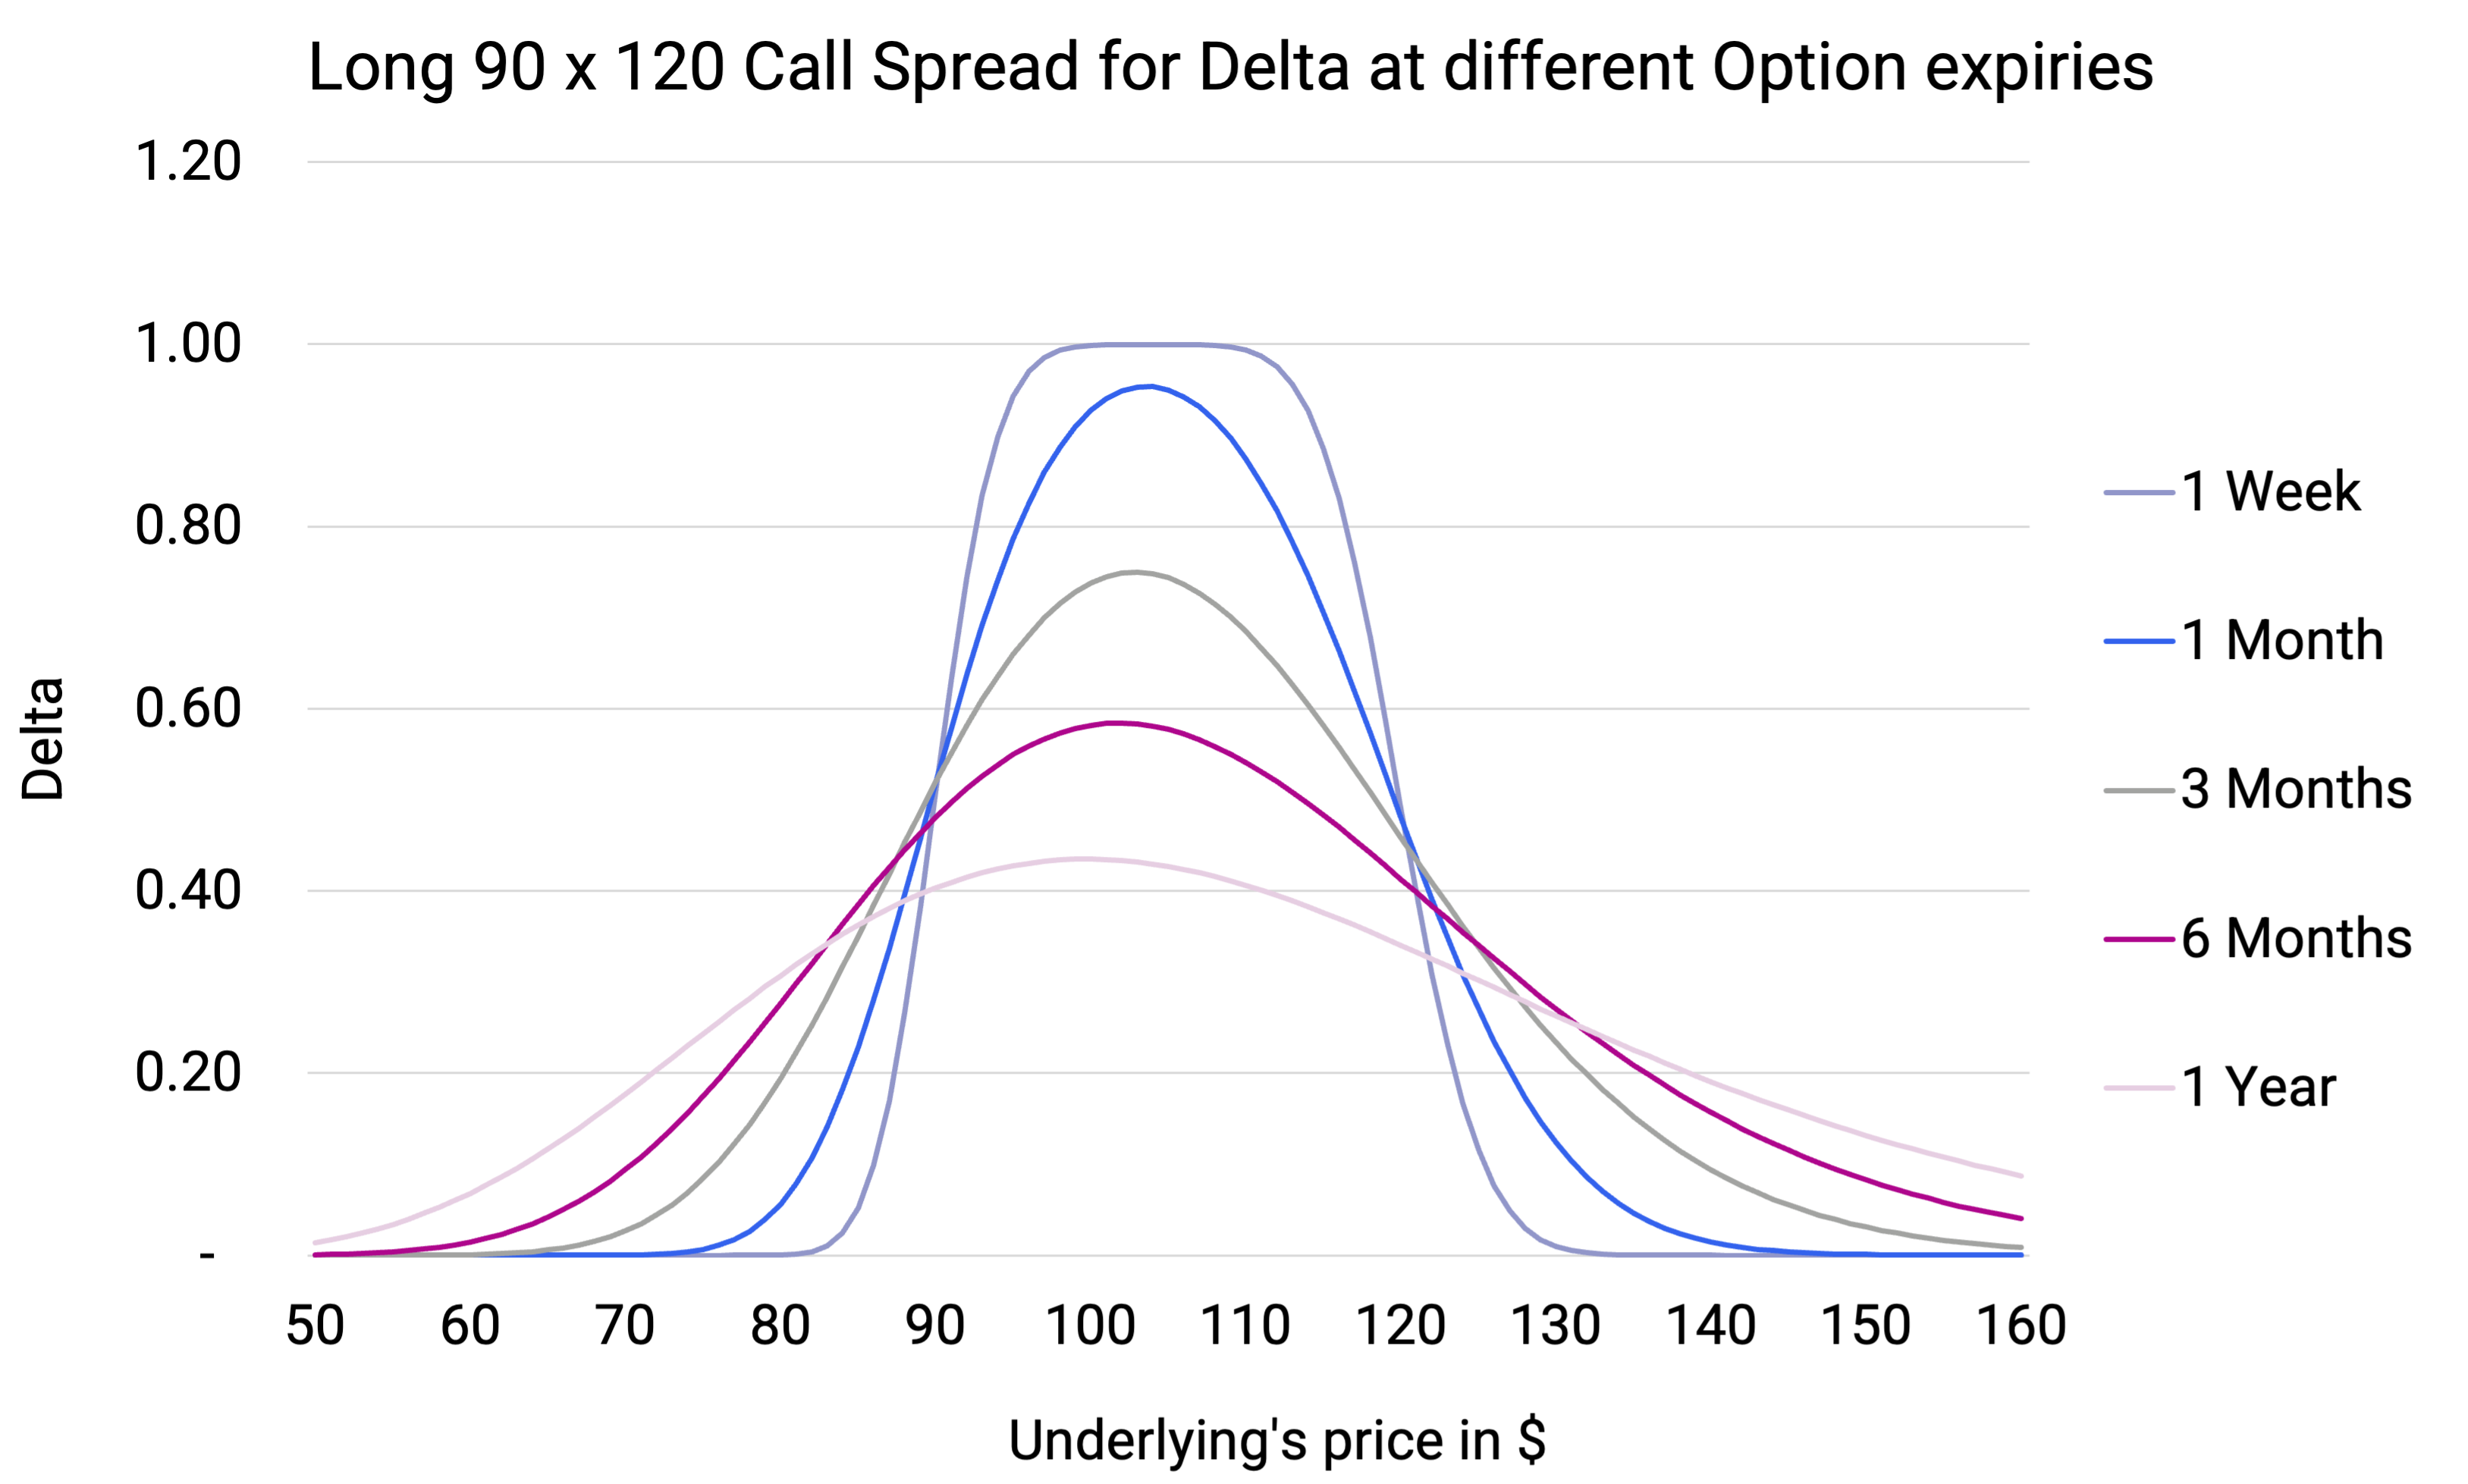
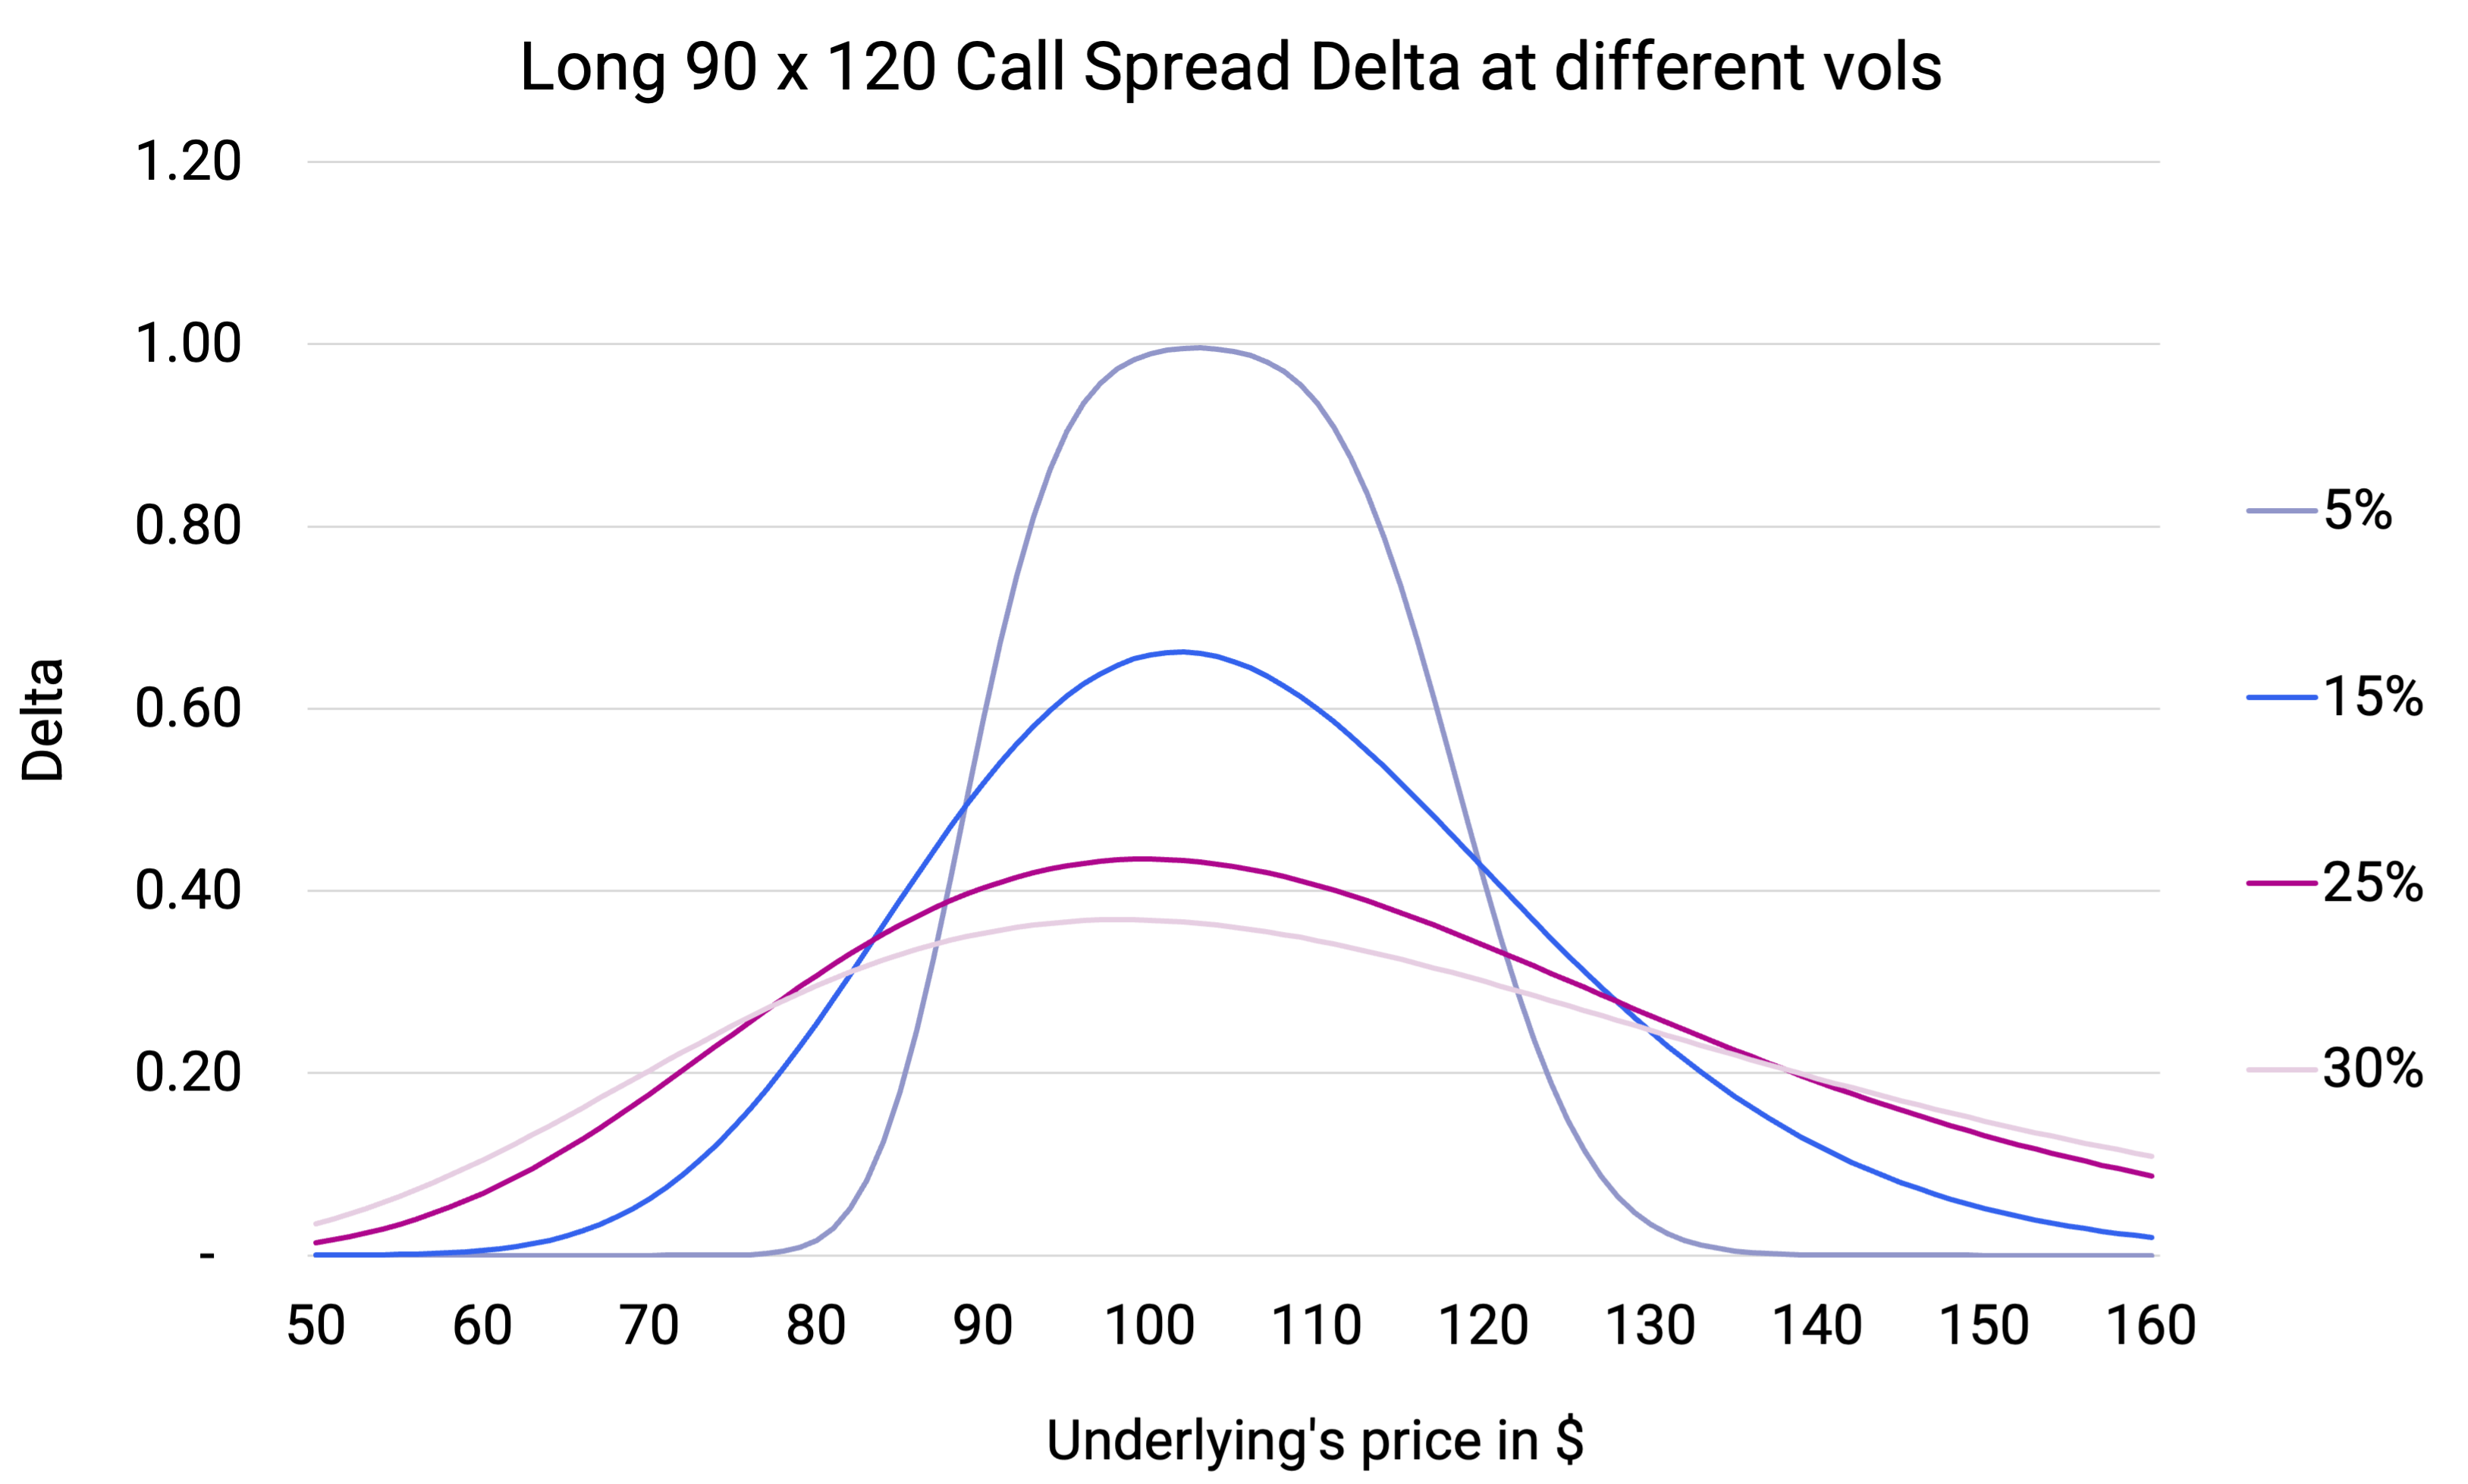
- Net delta is always positive because of the purchase of a lower strike call. It peaks around the middle of the strikes, declining as we approach the short call option tending to zero after the payoff is maximised. For spot levels below the lower strike the delta declines again tending to zero as it gets deeper out of the money.
- Gamma and Vega too would be a function of where the underlying price is relative to the strikes at inception. In general gamma and vega would be positive closer to the long option and negative closer to the short one.
- Time decay would apply till the spread behaves like a long option position, would slow down as we head towards the short option and eventually turn in favour of the buyer of the spread as the underlying price tends to the higher strike.
- Another similar looking payoff is observed in a strategy named “Collars” that’s a mix of three different positions – a long stock position where downside is minimised by a long OTM put with the latter being financed by selling an OTM call, with the put and call strikes assessed so as to create a 0 cost structure. Note therefore that both the downside and upside on the stock are limited.
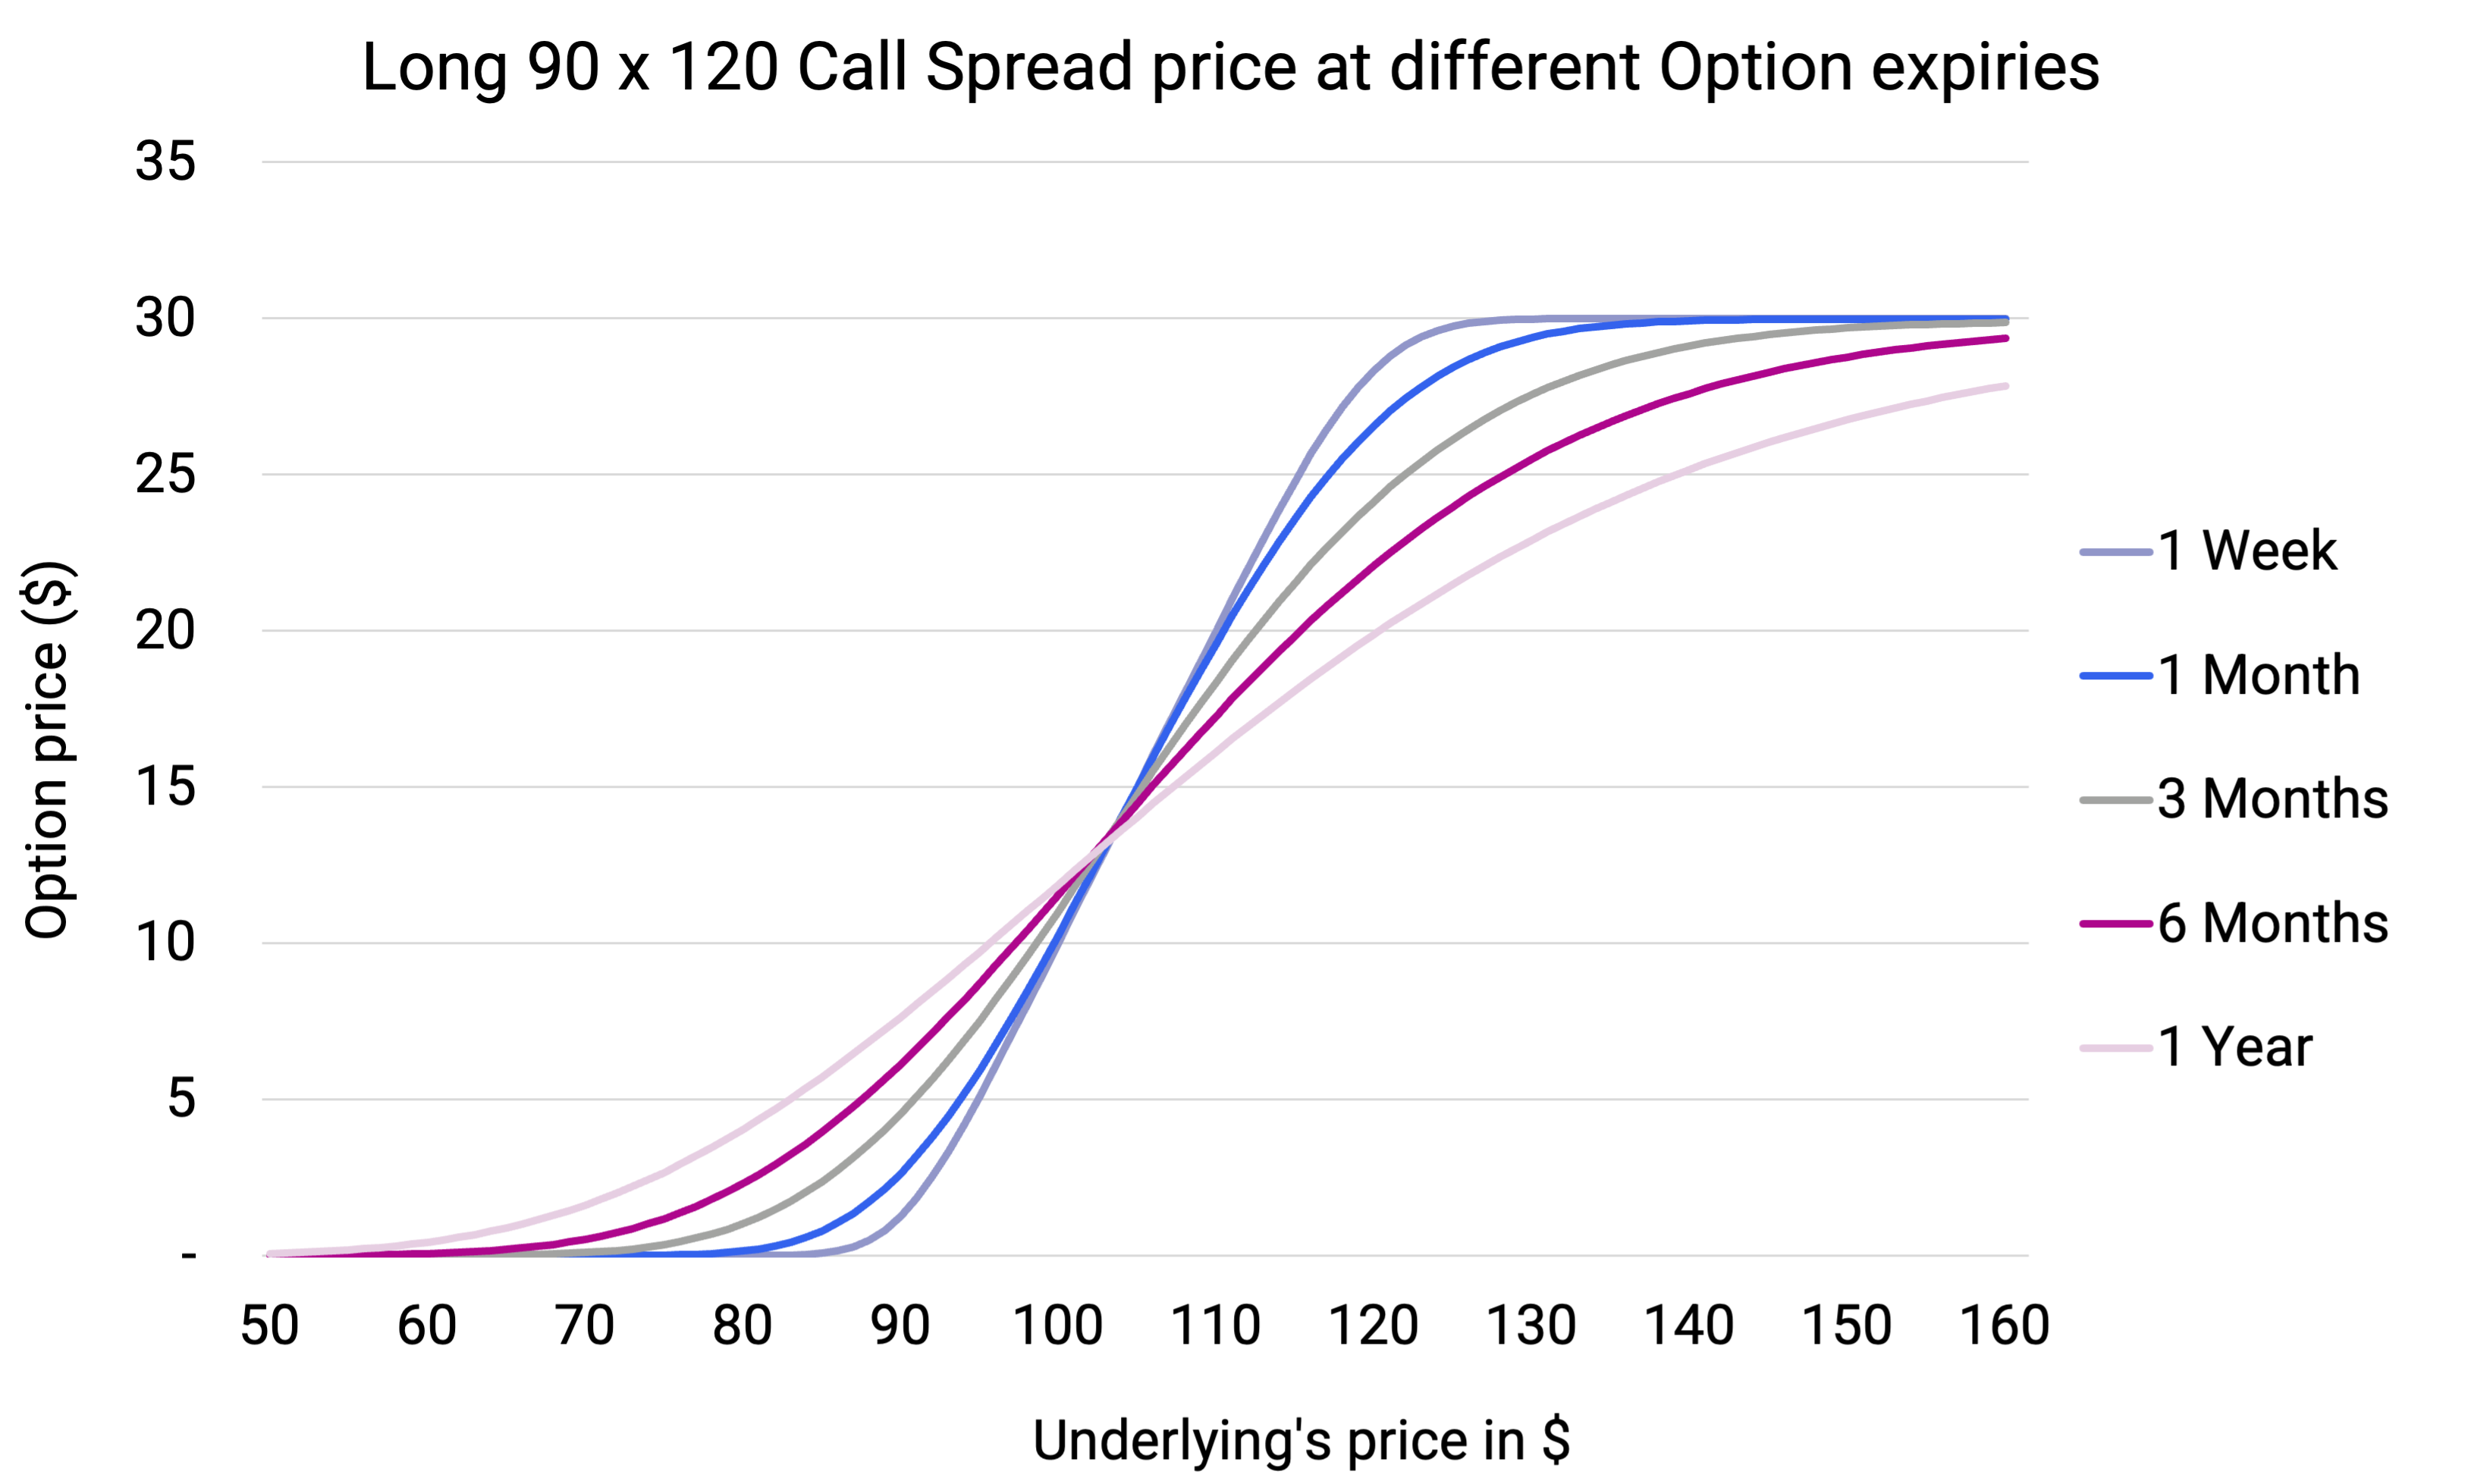
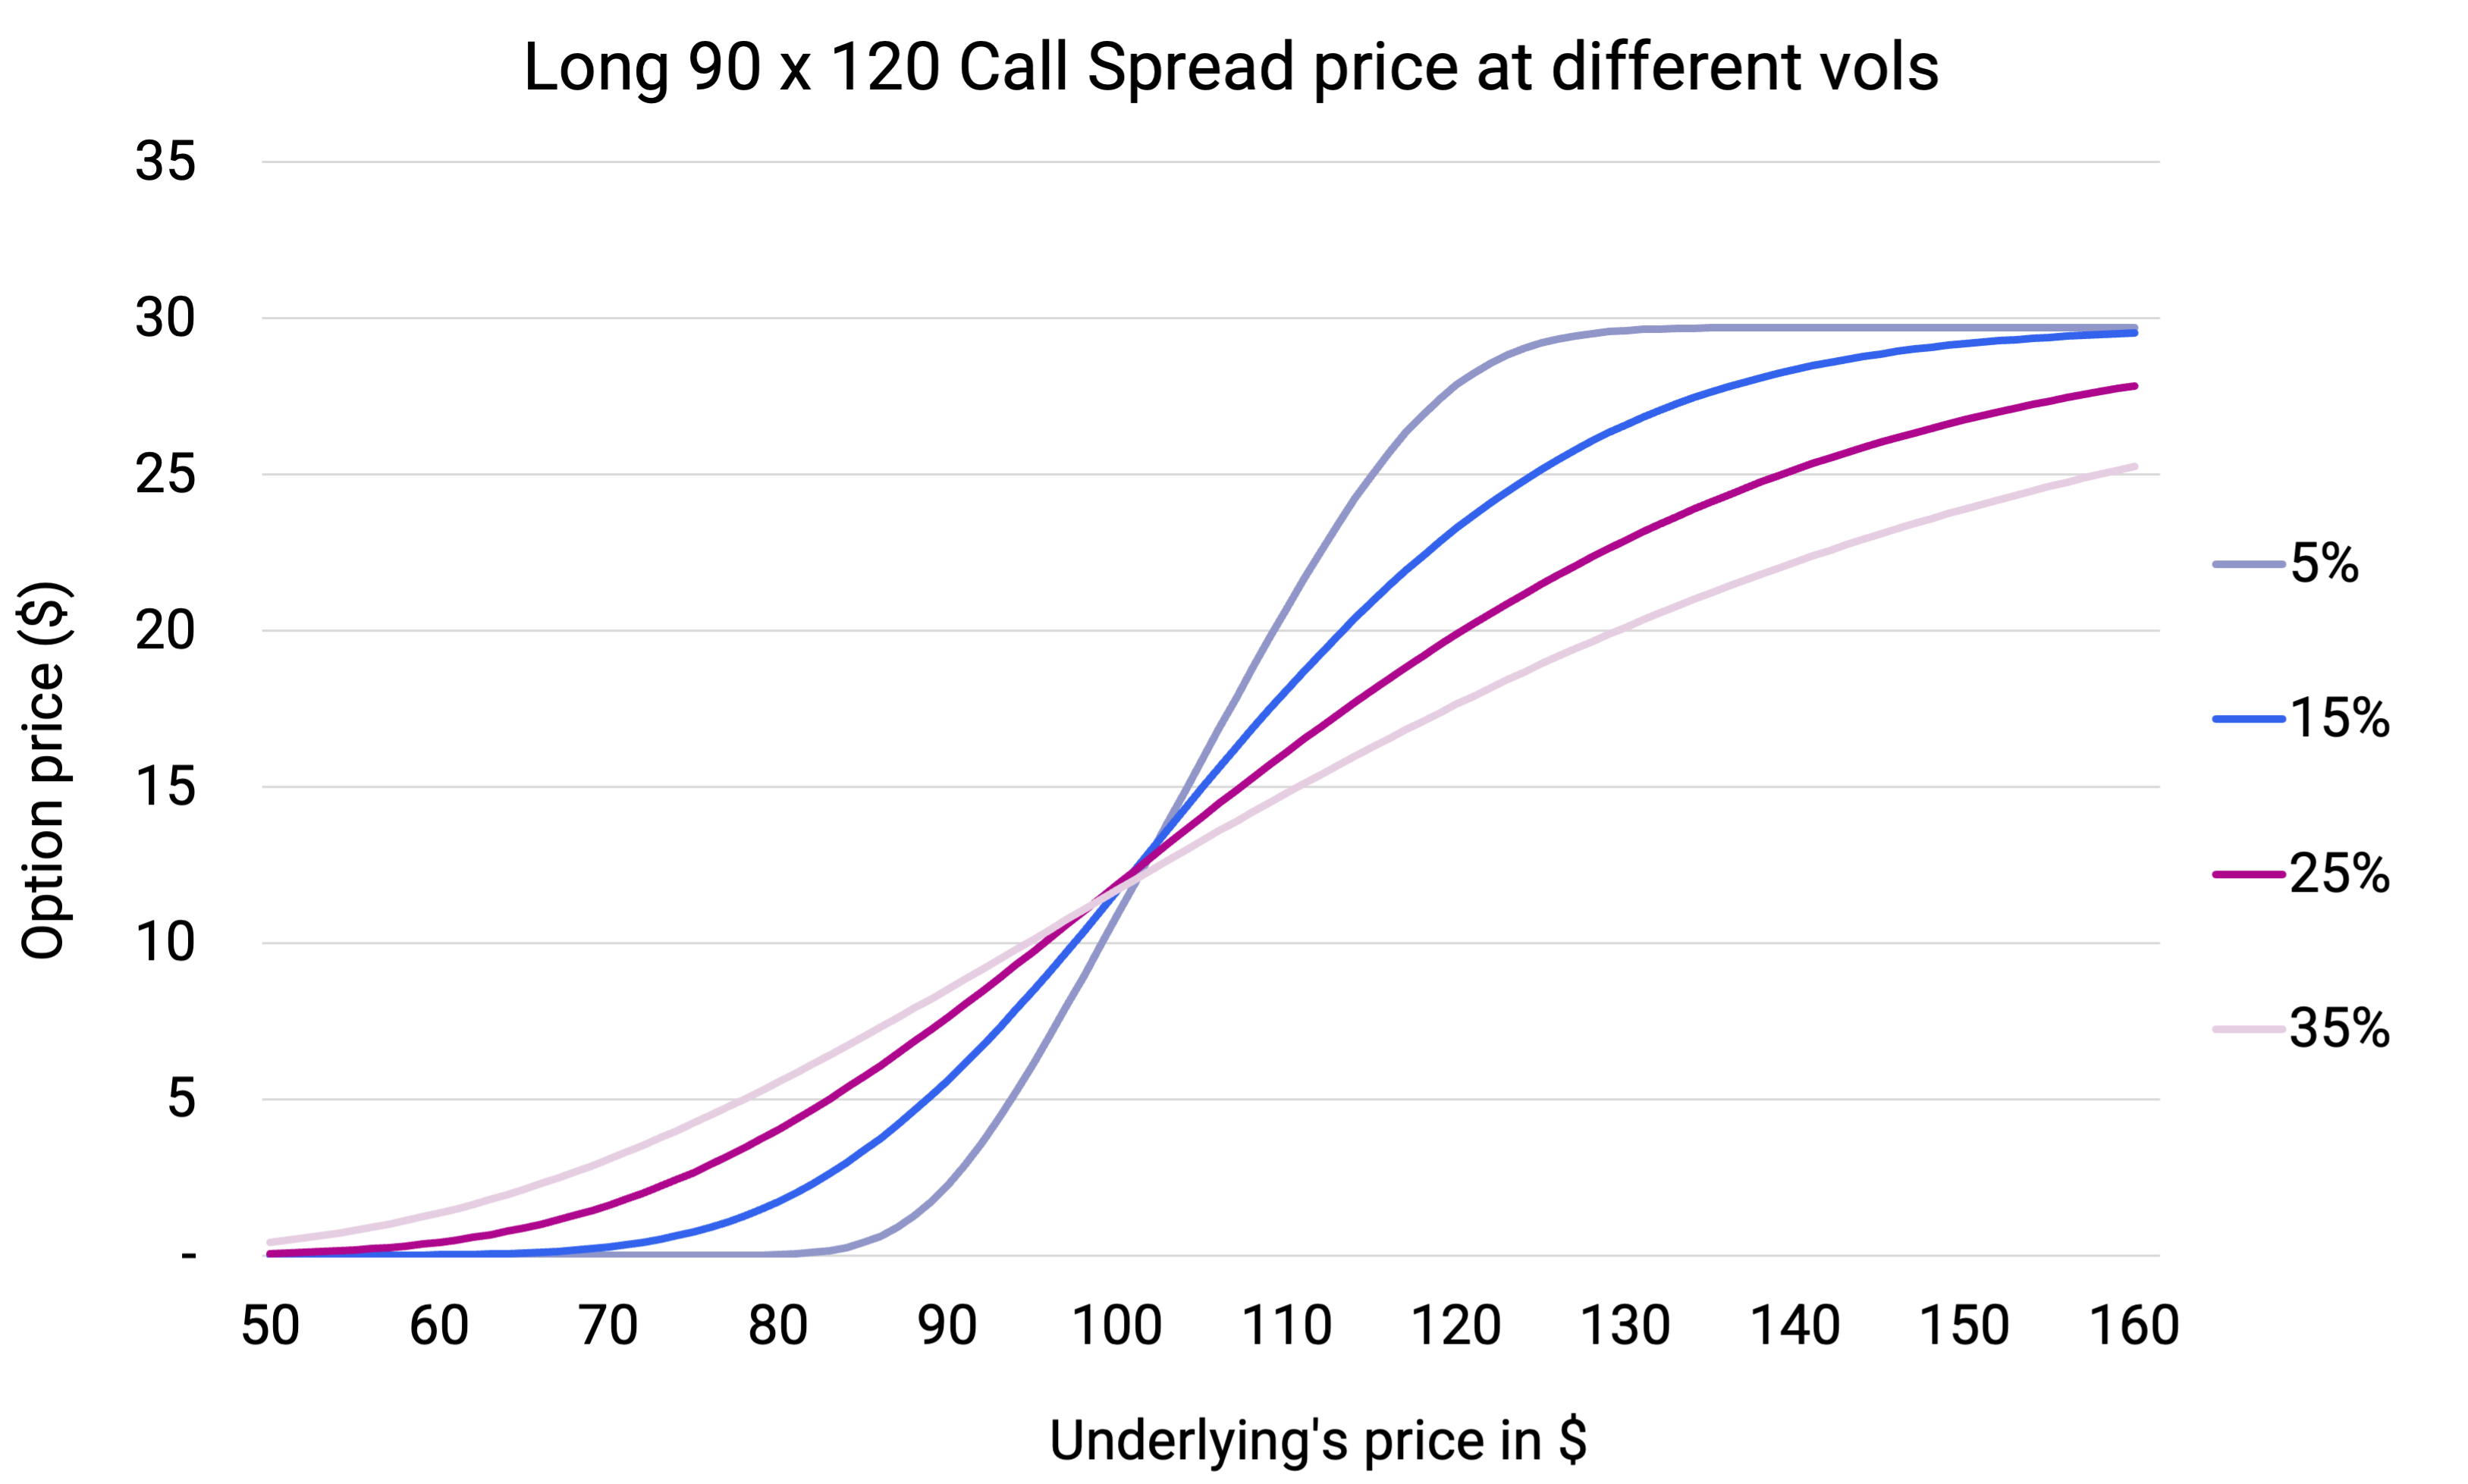
- Below is a graphical representation of the price and greek profiles of a 90×120 call spread.
Graph 33 – Call Spread price across Option expiries
Source: Pandemonium.
Graph 34 – Call Spread price across Implied Vols
Source: Pandemonium.
Graph 35 – Call Spread Delta across Option expiries
Source: Pandemonium.
Graph 36 – Call Spread Delta across Implied Vols
Source: Pandemonium.
Graph 37 – Call Spread Gamma across Option expiries
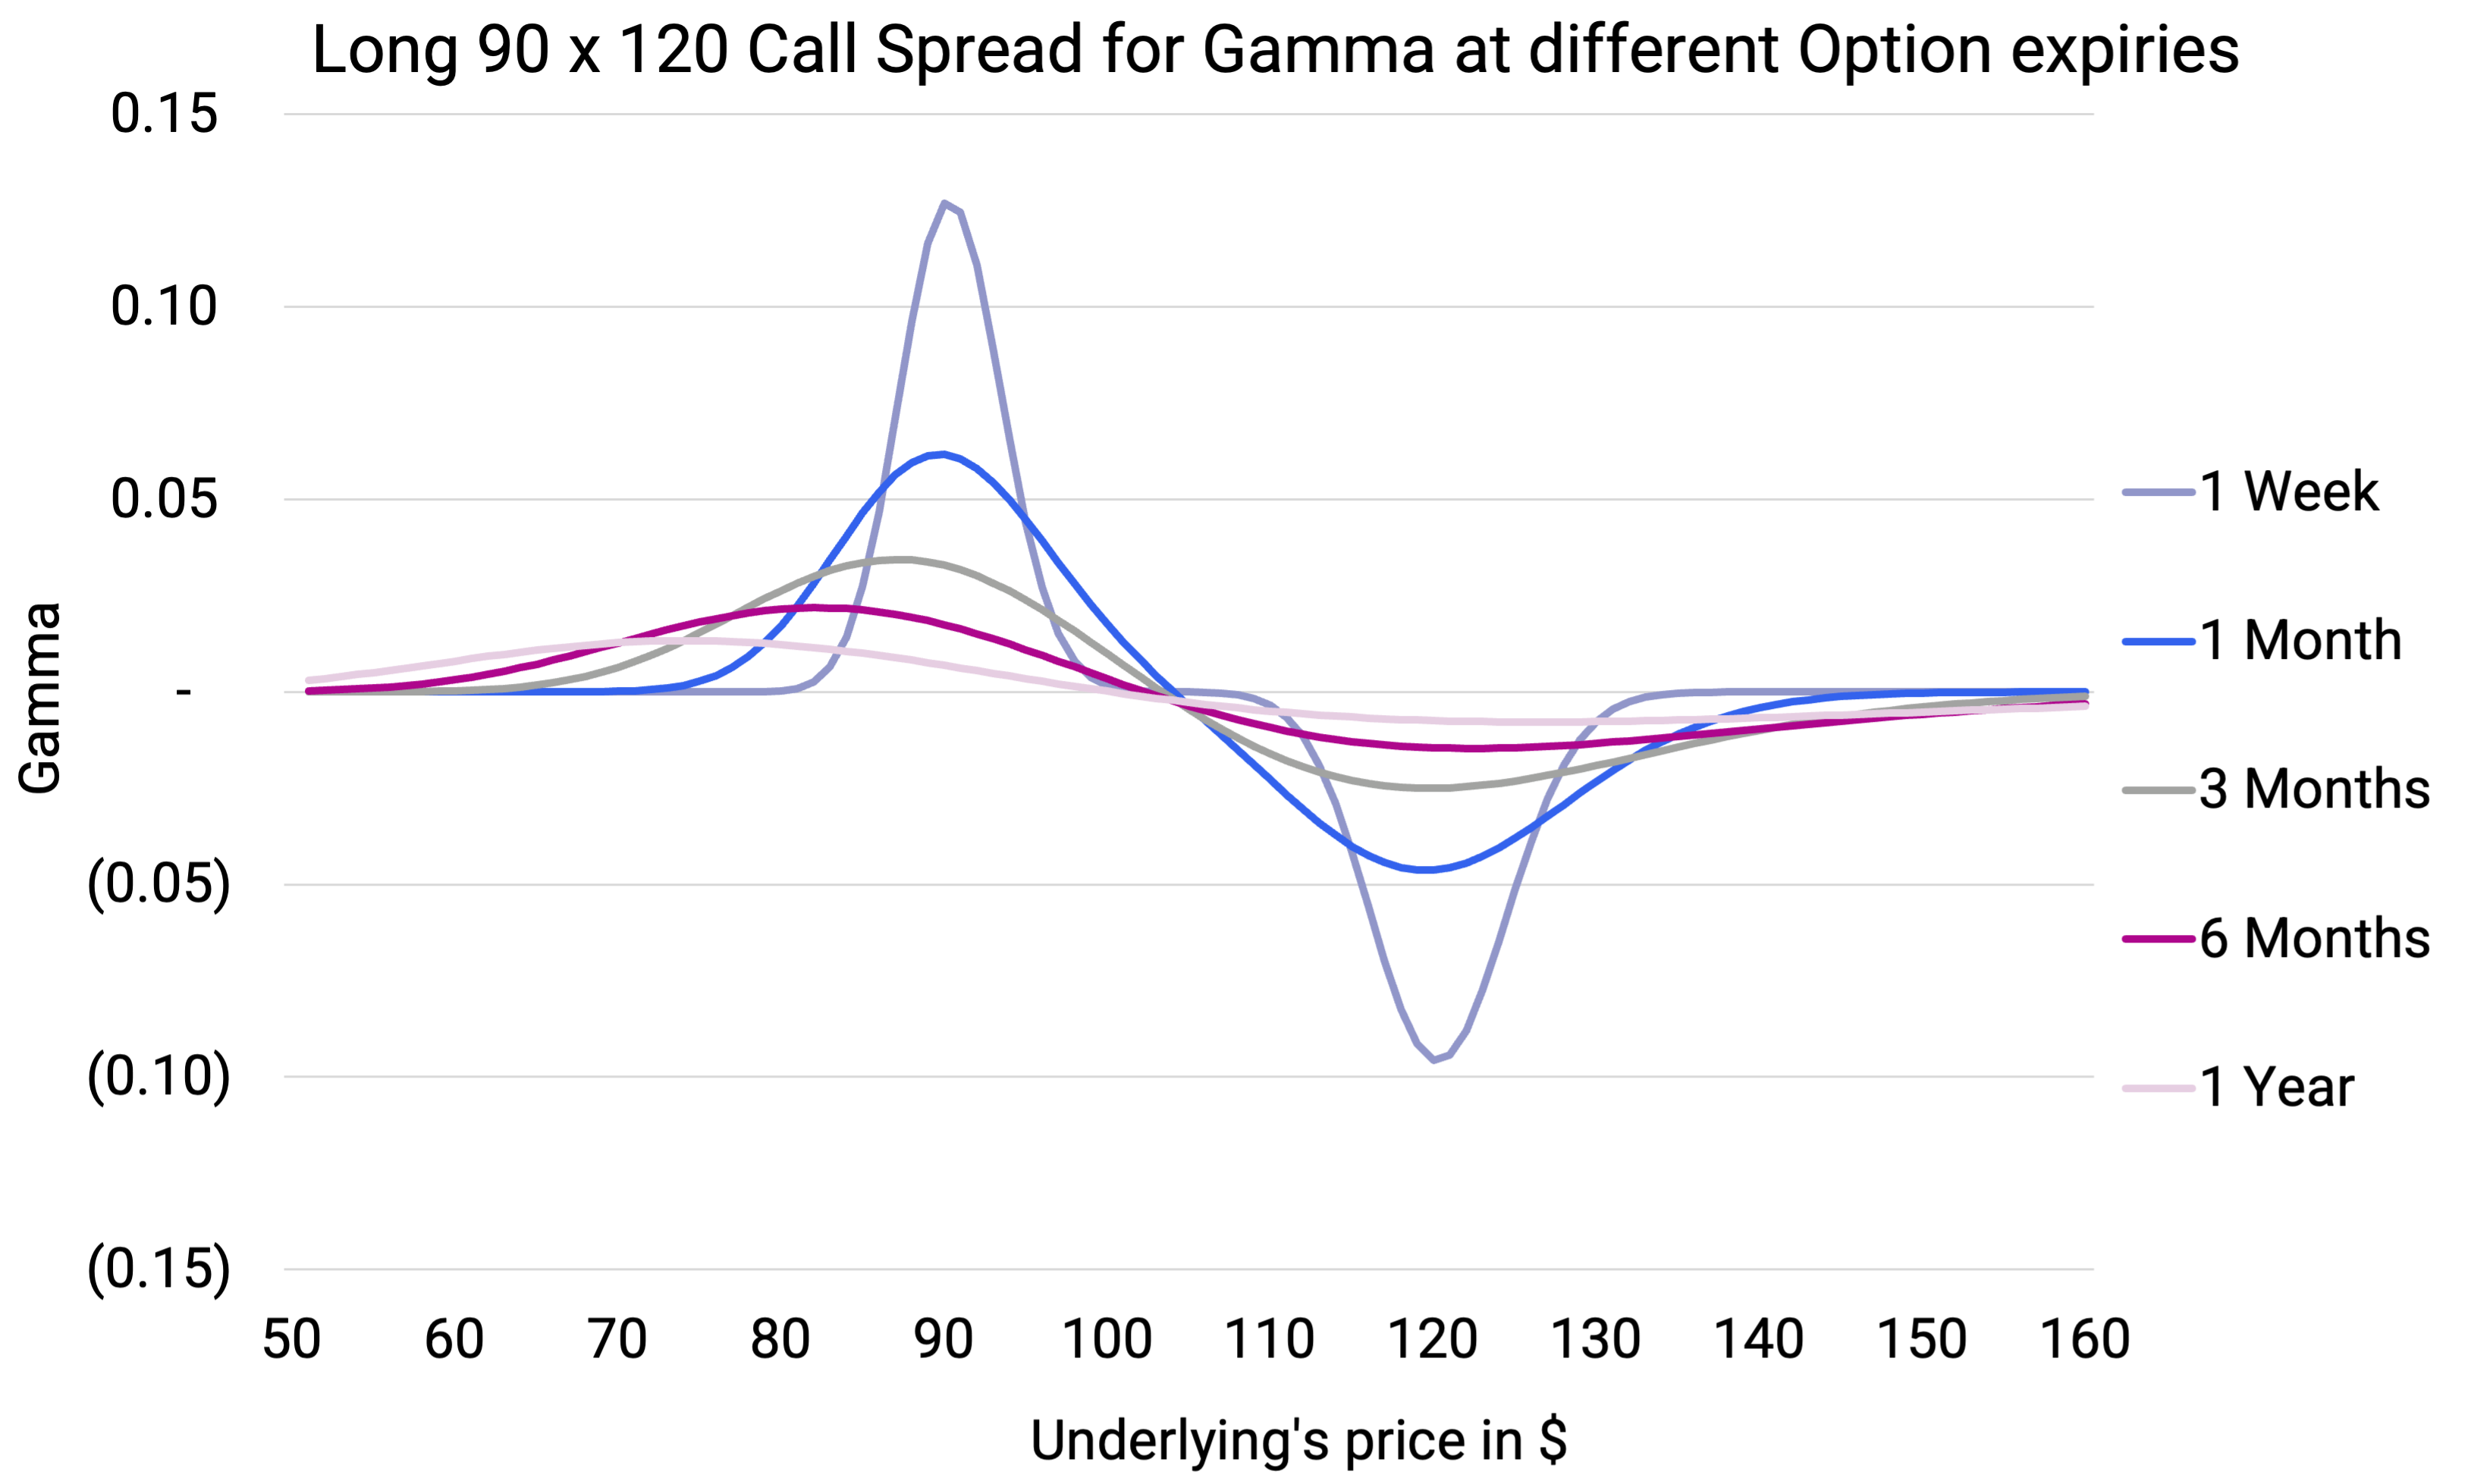
Source: Pandemonium.
Graph 38 – Call Spread Gamma across Implied Vols
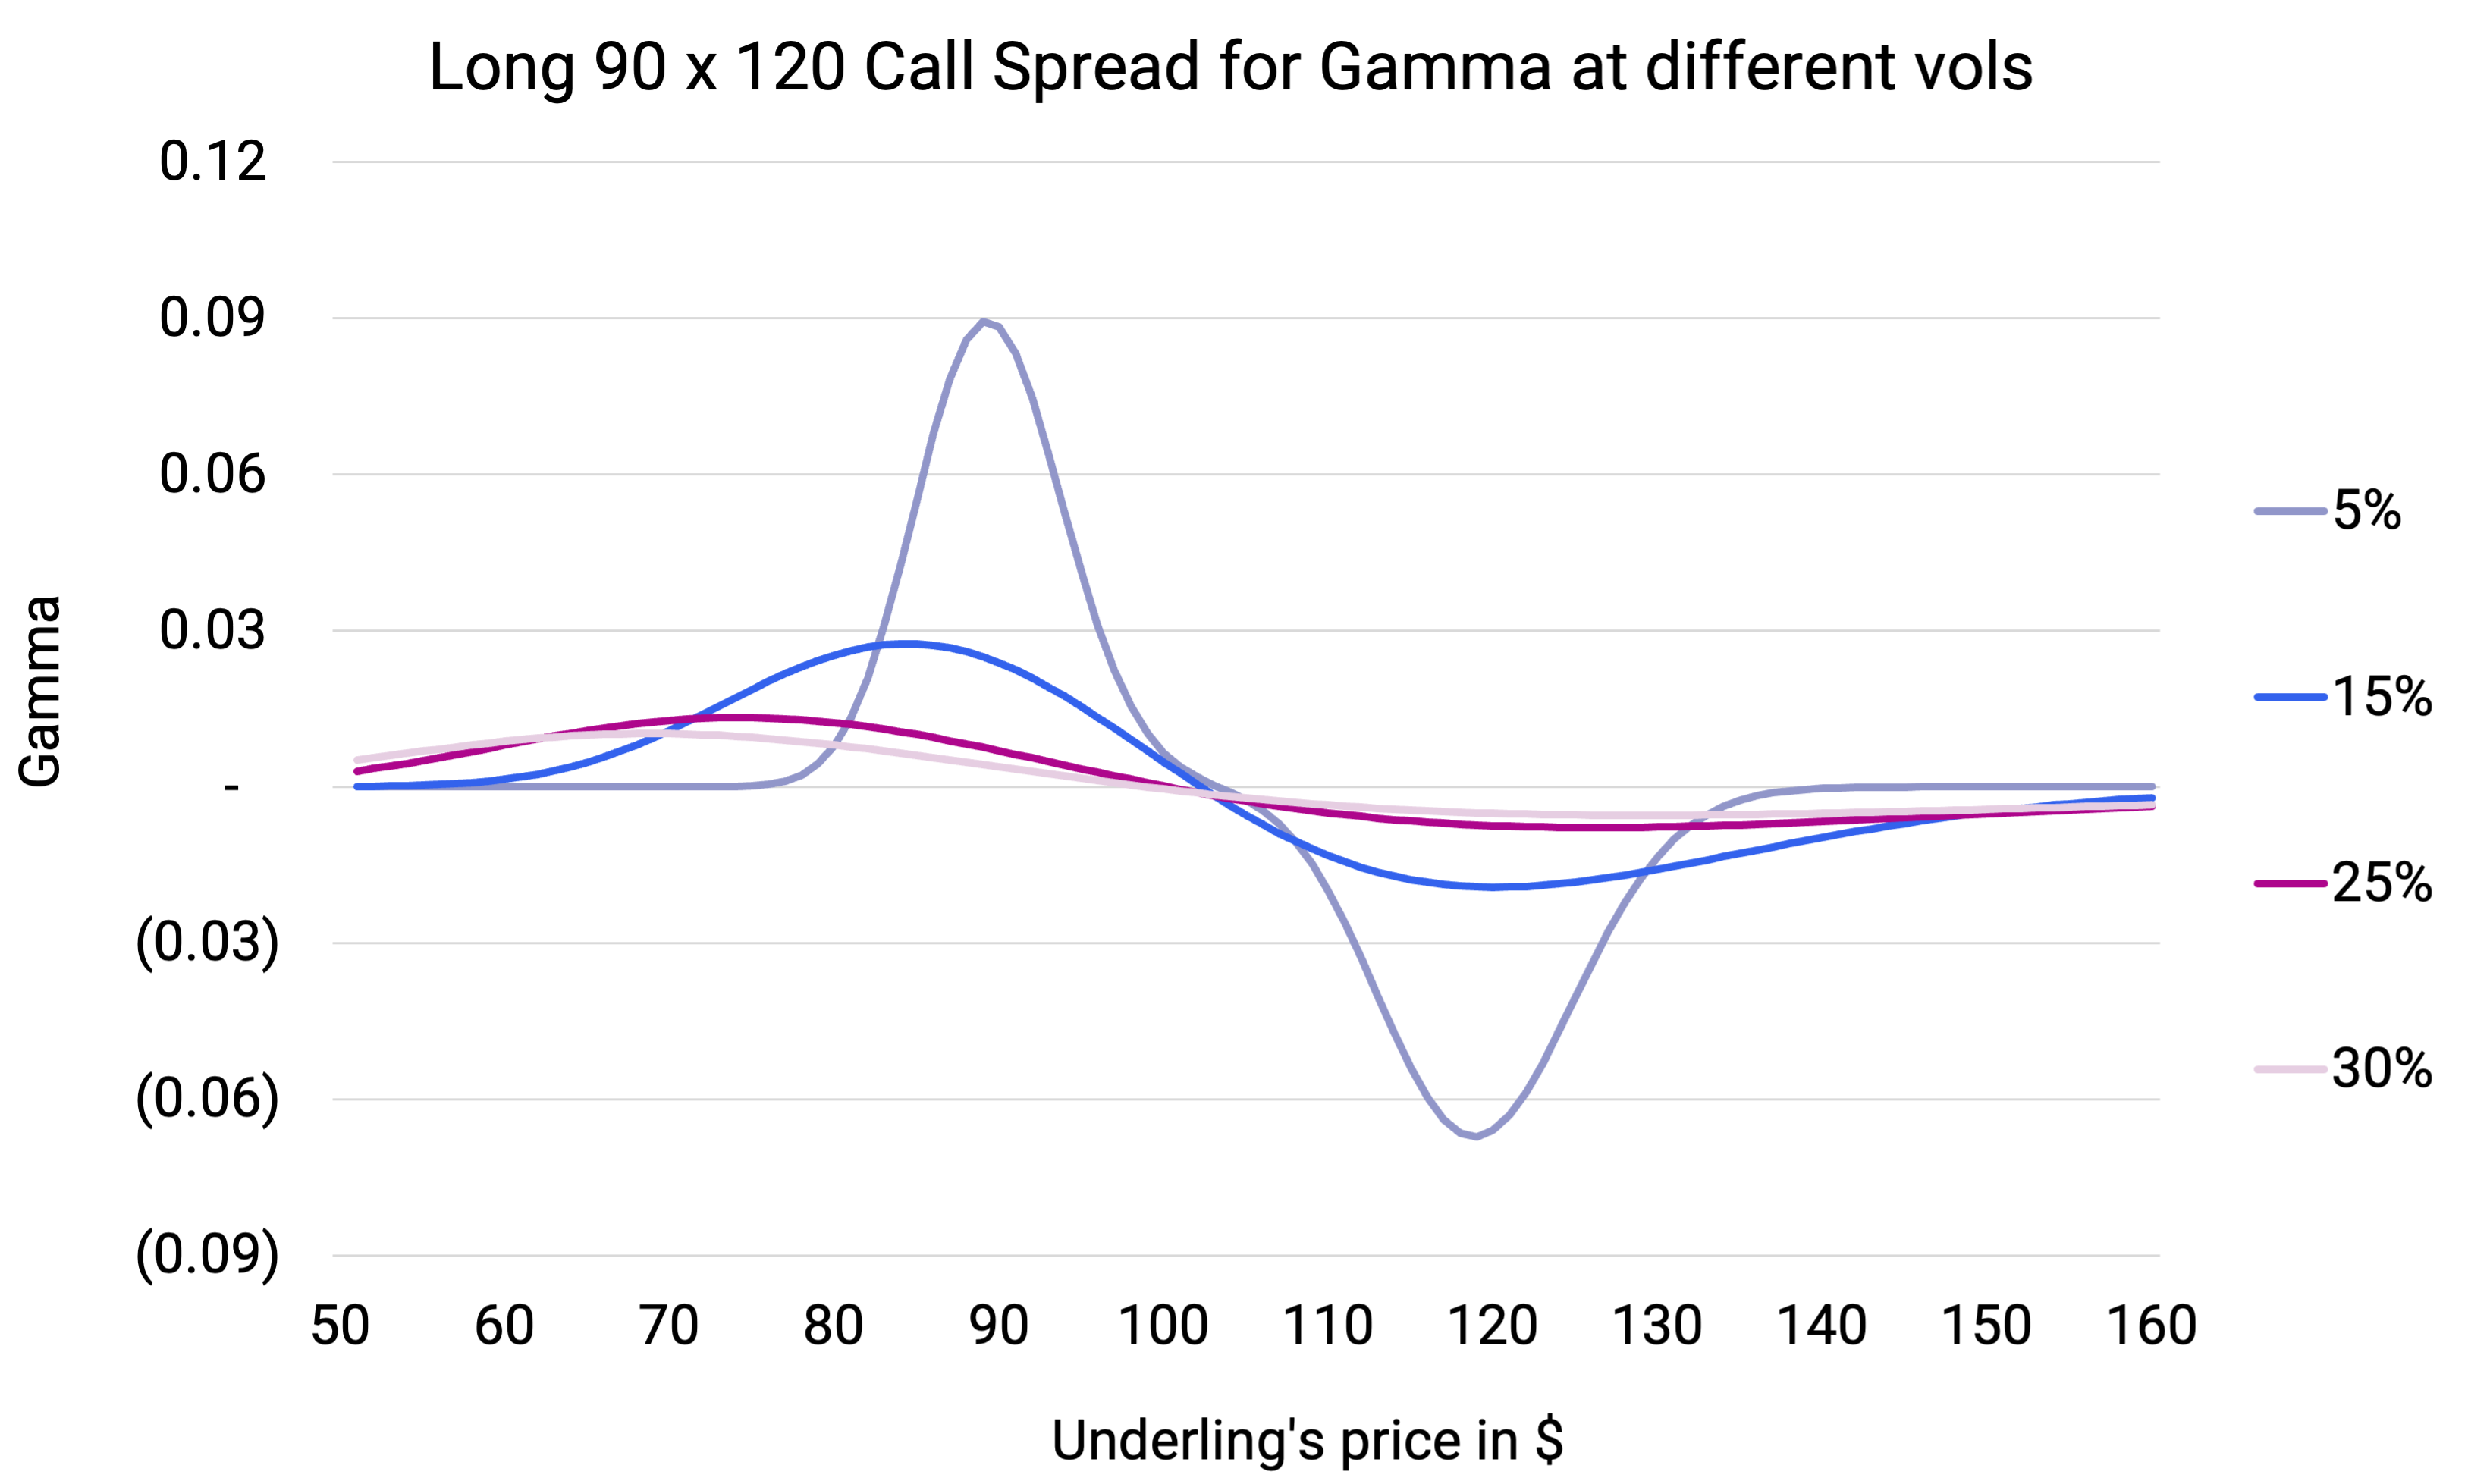
Source: Pandemonium.
Graph 39 – Call Spread Vega across Implied Vols
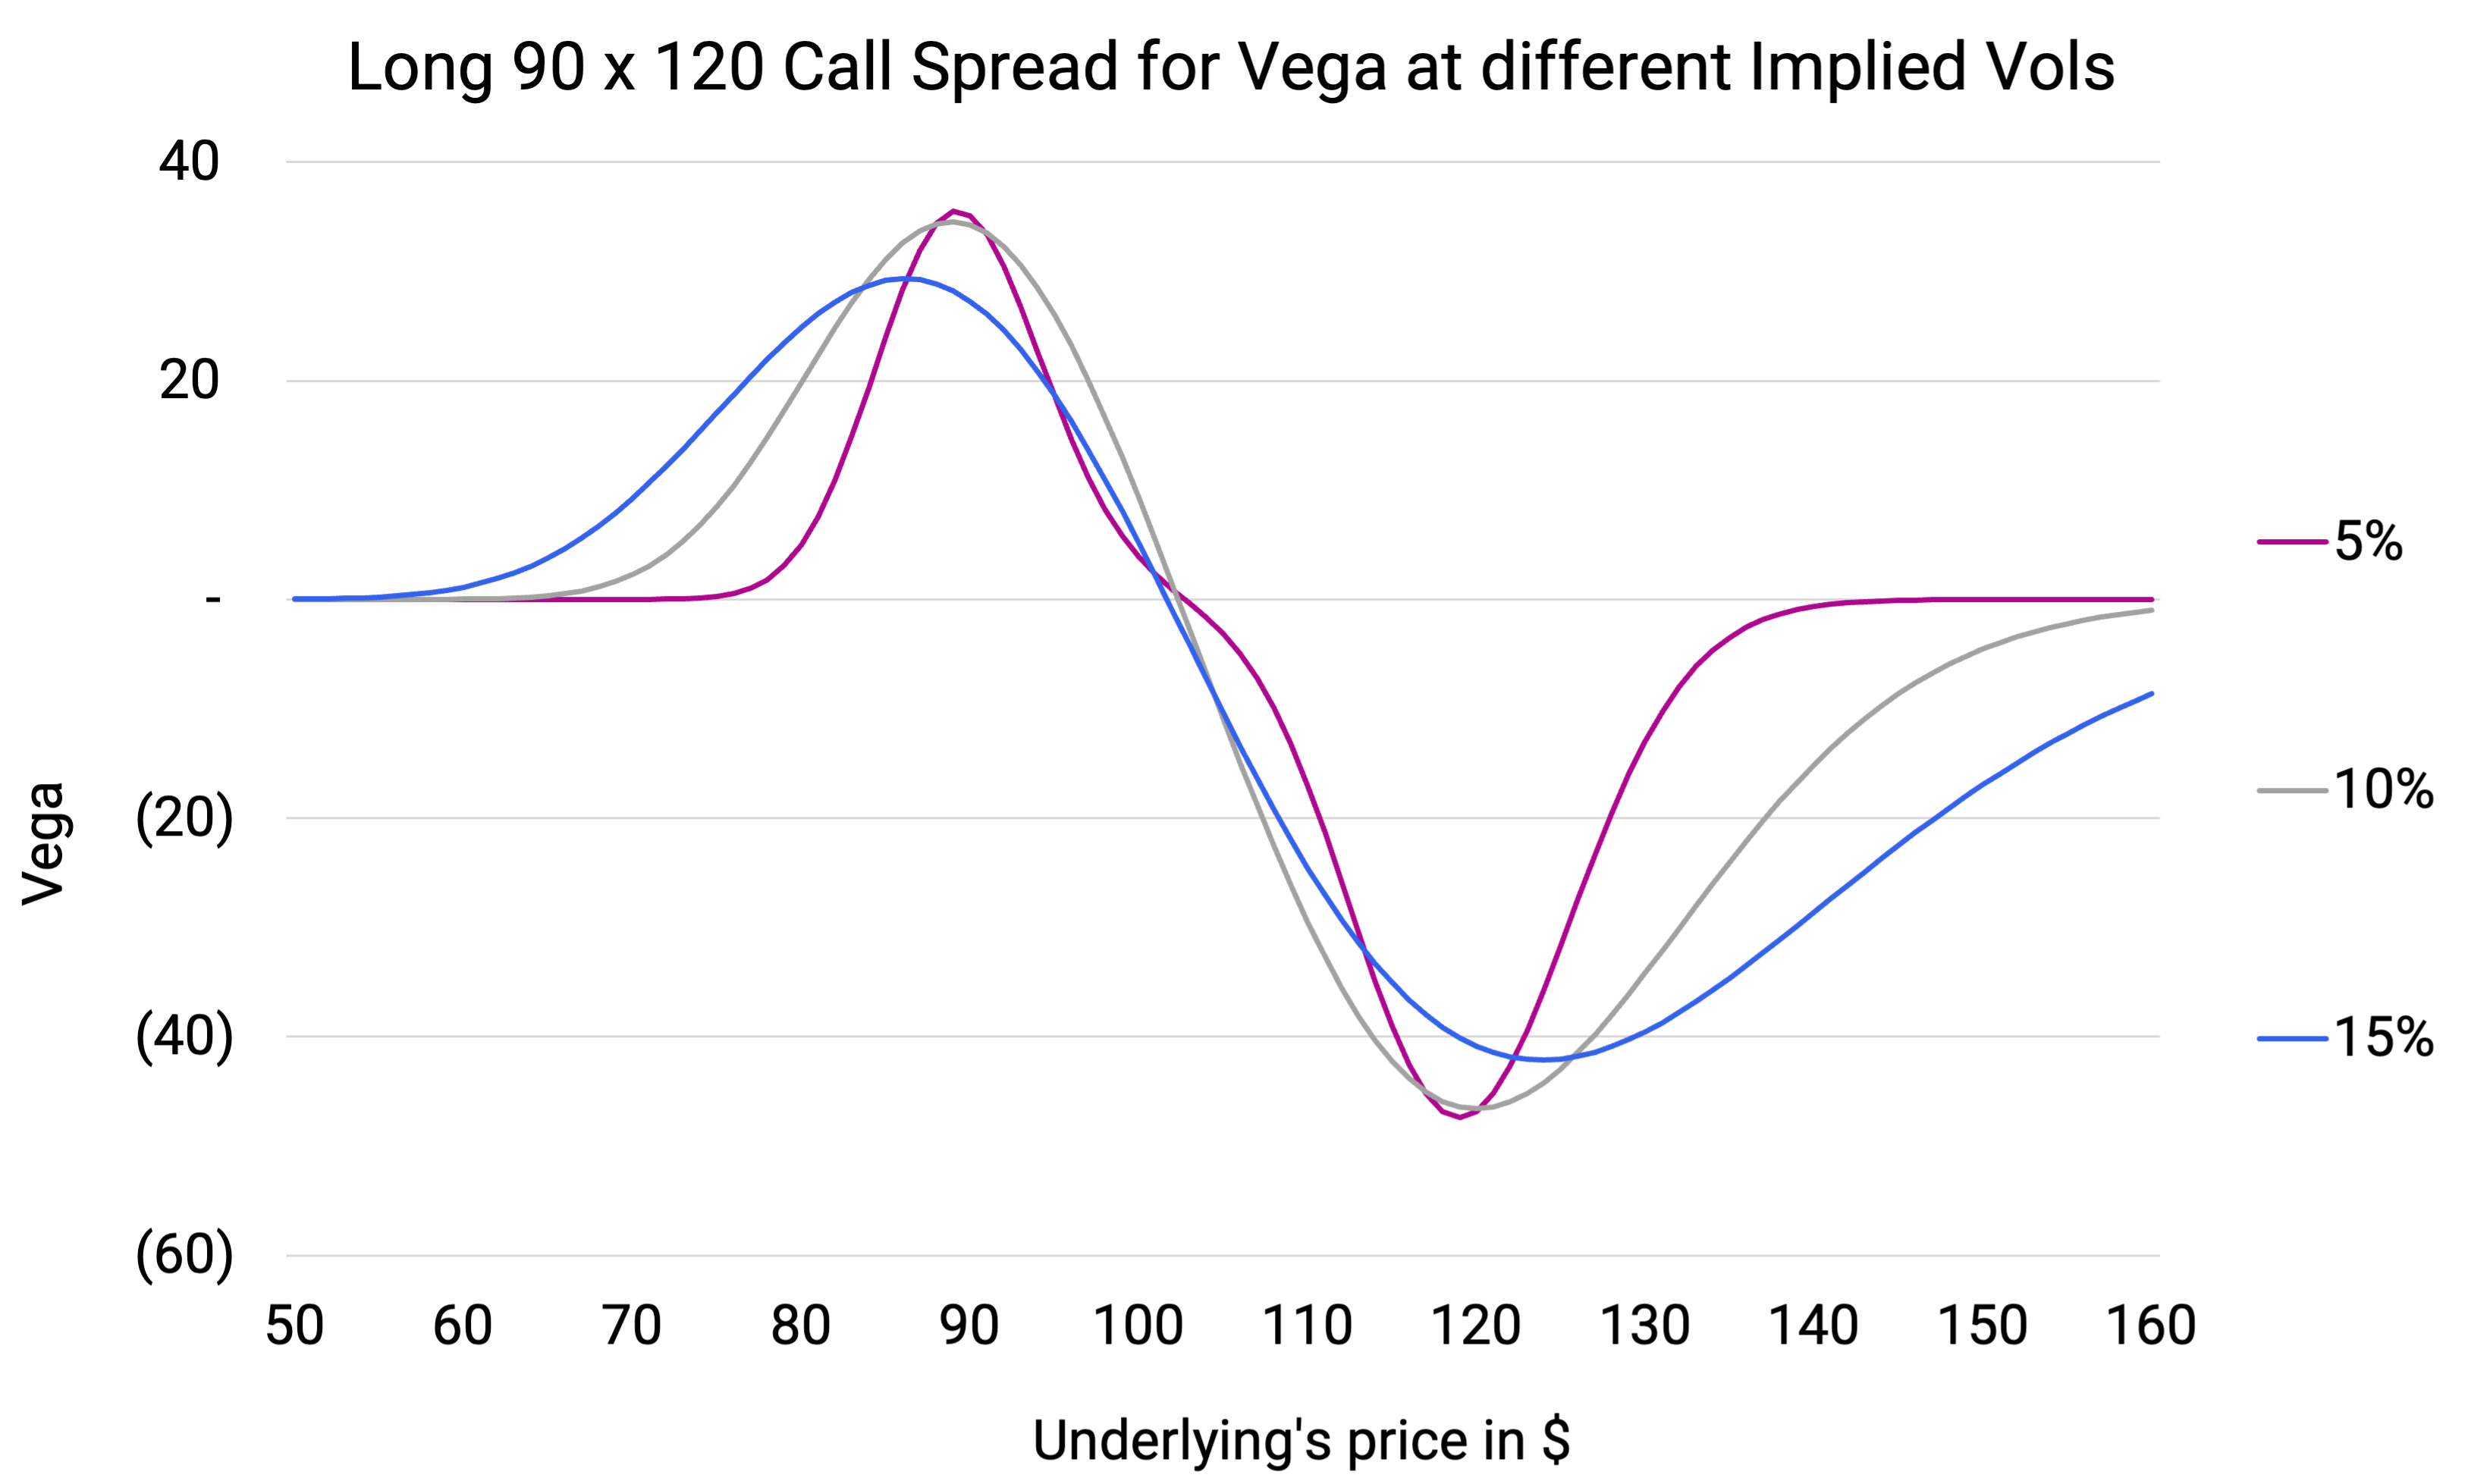
Source: Pandemonium.
- Since this is the first leverage-based strategy we are discussing it’s important to remember that when the underlying move in spot is quick and the short option (done to cheapen the structure) gains value, the gains on the strategy are limited a lot more (versus a gradual movement in spot) through the tenor of the contract. In case of the call spread for instance, time value goes in favour of the higher (OTM at inception but ATM when spot reaches it) strike that gains on account of theta but owing to a higher realised vol loses more on the short gamma and short vega. Hence the intent in the use of leverage is to wish for a gradual favourable move in the underlying through the tenor of the contract.


