


We are about to navigate back and forth between cash and derivatives and their mix to discuss some popularly talked about financing solutions in the fixed income world. Let’s start with the basics:
The value of any financial asset or liability depends on its expected future cash flows, present value of which is obtained by discounting it at a rate commensurate with the risk of the asset or liability. This discount rate is interchangeable with the internal rate of return or the expected return on that funding over a specified tenor.
If you had to link the risk profile of an asset or a business with its expected return – higher risk warrants a higher return over the risk free rate – this return would determine the marginal cost of funding today or to be more nuanced the present enterprise value for a business.
Higher the risk of the funding instrument greater is the return expectation and so funding mix for any business would depend on its risk profile. For instance, Banks would have a lot more debt as a proportion of its total financing given their ability to lever up on the equity capital (equity is the riskiest/most expensive funding instrument) versus private non-financial corporates, that means a lower average cost of funding for banks vs the non-bank sector.
Simply put unsecured funding is funding to an entity without prejudice to any of their owned assets while secured funding is what is backed by a defined charge on the assets (exclusive or not). In addition, secured funding may or may not have recourse to the entity/borrower of funds – common example being a collateralised loans portfolio of a bank that has recourse to the loans but not to the bank.
For the sake of restricting the content to collateralised credit instruments (for now) let’s focus on secured funding products:
Repurchase agreements (Repo) – Is a mode of financing against underlying assets with a promise to return the underlying at the end of the borrowing term at a fixed price. Most common example is a repo against a sovereign bond that’s generally priced as a non-recourse borrowing since risk of the underlying will most times be superior to the credit risk of the borrower. Cost of this financing or the repo rate is a function of the risk of the underlying (being repo-ed) and its relative demand/supply.
Connecting the dots. FX swaps are also a form of repo financing i.e. collateralised exchange of cash in different currencies, implied yield on which is determined by the relative interest rates.
Two types of risks to think about:
Comparison between ‘Standard’ Market Repos and Securities Lending/Borrowing (can be used interchangeably with Collateralised Lending/Borrowing)
Table 1.
| Salient Features | Repo | Securities Lending/Borrowing |
|---|---|---|
| Master Agreements | Global Master Repurchase Agreement (GMRA), but contracts can be structured under ISDA too (refer to TRS later) | Global Master Securities Lending Agreement (GMSLA) |
| Funding Yield (contractual difference) | Fixed Rate as normally short dated in tenor | Fixed/Floating as customised in the contract |
| Title Transfer | Full transfer of ownership | Varying degrees of transfer ranging from Charge/Lien on the asset to full ownership |
| Time of Title Transfer | At the start of contract | On a credit event in case of a Charge/Lien but immediate in case of full ownership |
| Intermediate Cash Flows | Goes to purchaser of the repo/borrower of the asset | Remains with the original owner of the asset |
| Standard exchange | Typical repo as in the fixed income world consists of an exchange of securities/bond for cash | Is an exchange of securities/bonds |
| Unwind of contract | Needs agreement of both the borrower and lender unless a credit event triggers an unwind | As this was an equities product at its genesis, title transfer of the security also transferred the voting rights/corporate actions on it. Securities Lender is free to execute a unilateral unwind to exercise a voting right/corporate action event. |
| Accounting Treatment | Fair Value option accounting for mark to market | Accrual based |
Source: Pandemonium.
Other considerations for repo pricing:
Trivia. Korea happens to be an exception in the region where despite the title transfer the intermediate bond cash flows belong to the original holder of the bond. The KRX Clearing House redirects the coupon cash flows to the ultimate beneficial owner of the bond. Hence repo rate is a funding rate payable on the cash borrowed instead of being implied in the sale and repurchase price of the underlying bond.
(For the sake of completion and not repetition I’ll cover this product in its most primitive format) – is a one sided borrowing/lending of securities without any exchange of cash; the table earlier is an updated description of the product as it trades today. The security borrower can use the borrowed security to either short the same or repo with another counterparty to generate cash. The security lender gets an additional spread over and above the current market yield to compensate them for the unsecured credit exposure of the securities borrower. Hence these (uncollateralised) trades were restricted to only financial intermediaries that have very sound credit.
Given the unsecured credit risk of this instrument the security borrower’s unsecured funding cost effectively works as a guide for pricing along with the repo rate of the underlying security. In case the security goes special in repo, the lending spread (to reflect the unsecured risk) over the security’s repo yield should increase. To sum up then – the opportunity cost of lending the security would be akin to repoing it and investing the cash generated into the unsecured loan of the borrower.
Given the risks associated with the clean lending exposure of the security borrower, these markets have evolved into a collateralised format as discussed earlier.
Repo cash flows can be mimicked by going long a bond in spot and selling futures on it (with the bond to be delivered on maturity). Difference between the futures and the spot price would imply the repo rate or interpreted the other way, given a repo rate and a spot price the future/forward price of the bond can be determined.
\[ \text{Future / Forward price} = \text{Current price} \times ( 1 + \text{Repo rate} \times \dfrac{n}{ 365} ) \]
The notation above calculates futures/forward price of a security/bond using the market repo rate, but for securities/bonds that have a deep futures market an implied repo rate can be calculated. Any basis between the implied repo and market repo (former lower than latter) would reflect the ‘special-ness’ of the security/bond on repo
Trivia. BoJ’s YCC and ‘Special-ness’ implied by JGB futures prices – market-wide bets on BoJ doing away with YCC (early 2023) triggered a wave of shorts on the cheapest to deliver bonds (those that would be delivered on the futures contracts) also part of the YCC operations. As the central bank bought more and more of the bonds under its operations it ended up being the sole lender to those who wanted to short them (short forwards) and in turn the sole buyer of the same in the cash market. This created more than a 100% beneficial ownership for BoJ on some of these bonds with large short forwards positions with the market. Basis between the implied repo rate on certain bonds (as calculated by JGB futures that built large short positions and their cash prices) and the market repo rate reflected by the JGB yield curve was a reflection of the ‘special-ness’ of those bonds; implied repo rates dropped to as low as -5%. Negative carry on the ‘special on repo bonds’ finally realised at the time of futures settlement as prices converged to cash markets.
When the currency of the cash lent is different from the currency of the underlying asset it is understood as a cross currency repo.
Asset Swaps – Is a term used to describe a ‘swapped’ return whereby an investor in a cash product desires to convert the return on it into the same currency or their home currency or another currency floating or fixed rate.
Connecting the Dots. Referring to the section on cross currency repos we can see now that asset swap level for an asset should theoretically be the same as the cross currency repo price of the asset.
Liability Swaps – Similar to an asset swap this is a term used to describe the swapping of funding cost of a liability of the borrower into fixed or floating rate in a currency of their choice.
Asset and Liability swaps therefore suggest the degree of attractiveness for both an investors’ return and a borrowers’ funding cost across different currencies relative to their local currency return/cost of funding.
Table 2 – Japan bills/JGB yields swapped into USD, EUR, GBP, AUD
| 3m | 6m | 12m | 2y | |
|---|---|---|---|---|
| JPY Bill Yield | -0.2% | -0.1% | -0.1% | -0.1% |
| JPY Asset Swap spread (bps) | -16.2 | -14.5 | -15.9 | -13.7 |
| JGB into USD ASW spread (bps) | 36 | 35.7 | 46.6 | 54.1 |
| UST / Tbills ASW spread (bps) | -6 | -5.5 | -13.8 | 9.8 |
| JGB into EUR ASW spread (bps) | 0.3 | -2.6 | -0.6 | 9.5 |
| German Bills ASW spreads (bps) | -53.9 | -69 | -75.2 | -80 |
| JGB into AUD ASW spread (bps) | 17.4 | 22.4 | 39.2 | 53.5 |
| AUD Bills ASW spread (bps) | 0.3 | 0.1 | -16 | -34 |
| JGB into GBP ASW spread (bps) | 17 | 23.2 | 32 | 39.3 |
| GBP Bills ASW spreads (bps) | -17.6 | 1.5 | -40.5 | -65.2 |
Source: Pandemonium.
The table above compares the swapped returns on JTDBs (Japan Treasury Bills, across tenors) in four different currencies with their local bill yields, both stated as an asset swap spread over their respective floating benchmarks. To understand the calculation let’s consider the investment of a US based investor in a 3 month Japan treasury bill trading at -0.17% yield swapped into USD. Order of cash flows would look like the following:
In the emerging markets world, Korea and Taiwan are two current account surplus nations with ageing demographics, mature growth cycles and hence the need to generate returns on domestic savings via exposure to foreign currency assets; onshore asset managers/lifers have large dollarised investment books. Much like the cash flow dynamic above that swapped the return on a foreign currency to the investor’s home market floating index + spread, local EM investors also compare the returns on foreign bonds swapped into their home market floating index + spread with local sovereign/corporate bonds yields. But the direction of cross currency basis flips in this case i.e. a Korean asset manager would receive USDKRW cross currency basis to swap the returns on a USD corporate bond into 3m CD + spread.
Similarly for liability swaps consider an example of a Korean Corporate contemplating raising USD funding. A key difference here vs asset swapped returns would be to assess attractiveness of a foreign currency funding by converting it to local currency + spread (let’s say KRW 3m CD + spread) and comparing it with the local corporate issuance yields expressed as 3m CD + spread again. Decision making process for raising 3y USD (as an example) funding would involve:
To summarise – the impact of cross currency basis on asset and liability swaps for asset managers and corporate borrowers of the same country is diametrically opposite. Cash flow description above makes it clear that a deeply negative basis swap would ‘reduce’ the asset swap spread and ‘add to’ the relative attractiveness of foreign currency funding vs local funding, and vice versa.
Collateral Swaps – is the exchange of two different assets for any given tenor. The lender of the lower quality collateral generally pays a spread to the lender of the higher quality collateral. The assets can be and generally are in two different currencies. The motivation for these trades is largely portfolio optimisation wherein a passive investor could enhance the portfolio returns by swapping collateral (credit risk) without necessarily taking market risk on the weaker underlying. Treasuries in banks use these to acquire say higher yielding but High Quality Liquid Assets (HQLA) assets again without taking the associated market risks.
Typically above investment grade internationally rated (offshore) and equivalent locally rated sovereigns qualify for HQLA for the Global Banking system. In the same vein, (from the previous section) – Japan sovereigns (high rated and HQLA eligible) are/can be higher yielding versus local sovereigns, the only difference is that the holder would be exposed to mark to market risk.
Connecting the Dots. One can also think of collateral swaps as undertaking a repo purchase of an asset against a repo sale of the other asset.
The spread to be charged for a collateral swap should be the differential of the respective repo spread/asset swap spread of the exchanged assets. Or said another way the lower grade asset gets financed by the higher grade one, hence the difference between the asset swap return on the lower grade asset and repo funding cost of the higher grade one guides the collateral swap pricing.
As an example – a foreign dealer who buys a Korean bond at an asset swap spread of USD SOFR + 100bps would be willing to pay a spread of ~70bps to do a collateral swap of the Korean bond against an IG bond. This IG bond could be repo-ed/ traded at an asset swap spread of USD SOFR+30bps. The dealer can use the IG asset to generate funding at SOFR +30bps and can fund the Korean asset at an overall cost of USD SOFR +100bps (including ~70 bps collateral swap spread).
Bond Forward are a product used by investors who anticipate the need to deploy cash in the future but want to lock in the current level of rates for that future purchase. This can be because a) they do not have the cash for immediate deployment b) they are in need of duration for their portfolio to correct duration mismatches between assets and liabilities c) for leveraged/enhanced return d) relative attractiveness of bonds vs swaps i.e. wider bond-swap spreads. You can simply think of it as a bond trade being priced for a future date, where the pricing is based on the spot price of the bond and the anticipated funding rate for the forward tenor. In the repo section we explained how the futures/forward price and spot price determine the implied repo/ funding rate of the bond. As a corollary, if we know the spot price and the funding / repo rate of a bond we can derive the no-arbitrage forward price of the bonds just like the forward prices on swaps.
If the yield curve is upward sloping i.e. repo rate for the tenor of the bond forward (say a 5y tenor of a 5y forward 20 year bond) is lower than the yield on the longer tenor bond (25 year bond) then the forward bond price will be lower (yield will be higher) than the current price of the bond.
Notional limit on being able to offer bond forwards would depend on the balance sheet capacity of banks.
Trivia.We have seen increased use of bond forwards by lifers in markets like Korea and India to increase duration risk in a portfolio similar to receiving fixed on long dated IRS but at a better yield given the positive bond-swap spread. The dealer (seller of the bond forward) needs to cover his short position on the bond by buying the bond in the cash market and or think of cheap ways of funding the same since emerging markets don’t really have active term repo markets.
- For eg. pricing of a 2y forward 30y IGB would involve buying the 30y IGB and pricing/funding it for 2 years at OIS + spread, effectively running a balance sheet position and a funding mismatch.
- For a highly rated market like Korea with attractive asset swap levels, one can think of tying up cheap KRW funding by doing a combination of collateral swap and a USDKRW cross currency i.e swap for the forward tenor. For instance a 2 year forward bond structure can be executed by first doing a 2 year collateral i.e. swap – exchanging KTBs for USTs at a fixed running fee of say 25bps (something that’s incentive enough for the UST lender). The USTs can be refinanced (repo-ed) for term USD cash which can be converted to KRW cash by doing a 2y Cross currency swap to fund the KRW bond purchase.
TRS is a contract wherein the buyer gets access to the economics/ cash flows of an asset on one leg via a derivative versus paying funding on the other leg of the swap. Key difference between a TRS and an asset swap – in case of the latter one physically holds the asset, returns of which are directly credited to asset holder with the swap used to hedge the interest rate or FX risk, while in a TRS all underlying returns of the asset are passed on to the holder but they don’t physically hold the asset.
Connecting the Dots. The funding leg could be seen as the repo price of such an underlying asset else arbitrage conditions could exist.
For those not familiar with break funding – this is an additional charge levied by the seller of the TRS (writer) who is expected to pay up their treasury in full the cost of the TRS funding tenor. A premature unwind would require the TRS buyer to pay up (make-whole) the residual funding charges to the seller. These are also known as ‘make-whole’ charges.
Trivia. TRS contracts are bilaterally negotiated and lack standardisation (unlike CDS contracts), hence dealers can differ in their valuations of such contracts even if economic terms are similar. As a result, novation of the contract to another dealer/bank gets difficult. For instance TRS valuation of a fixed rate sovereign bond to maturity could also be valued as risk free cash flows in that currency (i.e. like a fixed leg of an onshore IRS) since we know that the cashflow up to the bond maturity is fixed.
Carry on an Investment – probably one of the most overused terms in financial markets across asset classes is carry and roll, often used interchangeably. Let’s tackle each of them separately but before that – in simple terms one can look at the carry + roll (expressed in basis points) as the change in Present Value of an investment/portfolio due to the ageing of that investment/portfolio of trades while assuming no change in the underlying market conditions (i.e. no change in yield curve). Carry here refers to the net accrual on an investment (adjusted for its funding cost), while roll is the capital appreciation/depreciation due to the change in yield as the investment ages.
Let’s address them with different examples here:
Graph 1 & 2 – Carry & Roll Graphs
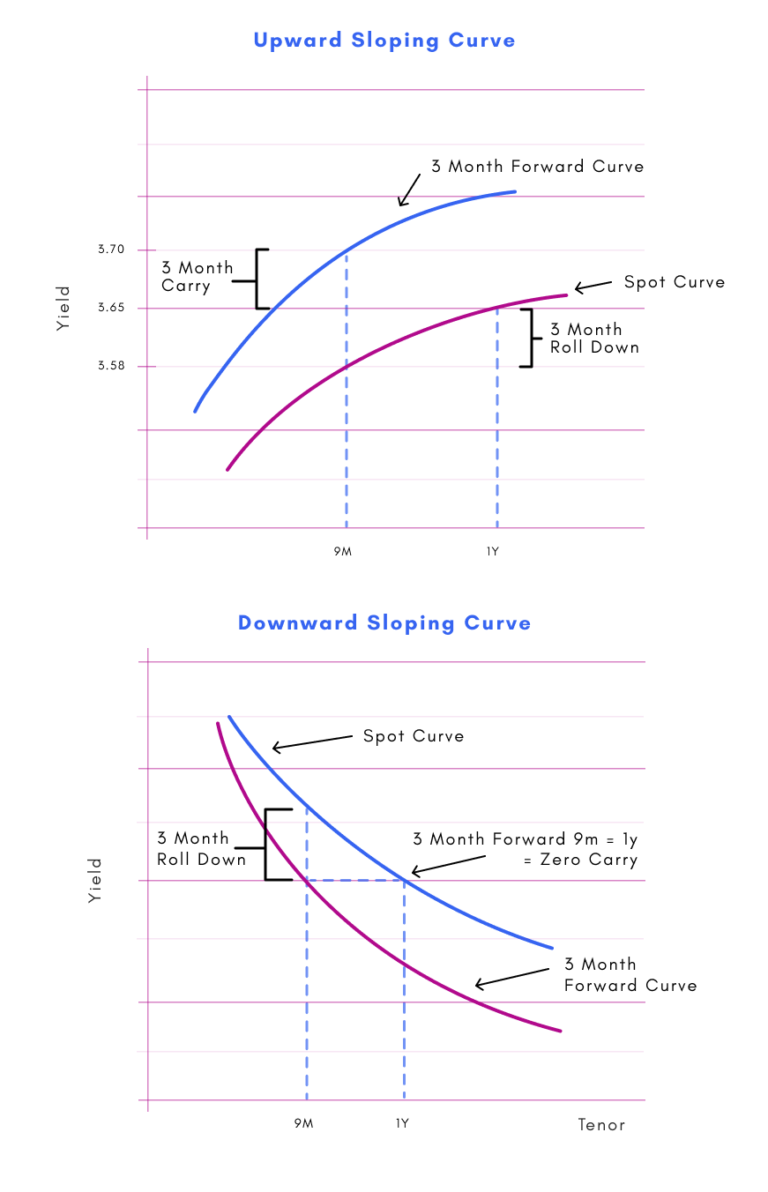
Source: Pandemonium.
| Tenors | TWD forward points | TWD forward Points Per Month (pips) | INR Forward points | INR Forward Points Per Month (pips) |
|---|---|---|---|---|
| Spot | 30.7 | 82.8 | ||
| 1m | -100 | -100 | 10.5 | 10.5 |
| 3m | -321 | -107 | 32.5 | 10.8 |
| 6m | -653 | -109 | 68.5 | 11.5 |
| 12m | -1260 | -105 | 162 | 15.5 |
| 2y | -2250 | -94 | 393 | 16.4 |
Source: Pandemonium.
Carry like for interest rate swaps can be defined as the daily points accrual vs the funding. For FX deliverable markets the daily funding would normally be denoted by the Tom/Spot FX swaps but those do not exist in the for non-deliverable FX markets. So we typically end up using the 1m (or the most liquid front end tenor) points as proxy for the funding leg; as such we use the monthly carry as a proxy for daily carry.
From the above table note that receiving INR 2y points at 16.375 pips per month and funding it by paying the short end say 3m at 10.8 pips per month would imply a carry of INR 5.575 pips per month if the curve remains unchanged. As for the roll-down just like for interest rate swaps – the 6mfwd6m points in INR are at 93.5pips (162 – 68.5 = 93.5) vs 6m points only at 68.5 implies a 6m roll down of 25 pips or 4.167 pips per month (that’s again assuming no change to the curve).
For assessing the richness/cheapness of the points curve, One needs to be careful to not rely too much on just points per month as the interest rate curve steepness / flatness at the very front end and relative funding on local vs foreign currency plays a big part too upon adjustments for interest rate parity/other (changing) demand vs supply dynamics.
Pandemonium is markets intelligence with the intuition of a dealing room — fifty-three lessons across rates, credit, FX and options. The intuition first, then the mathematics, then the trade. Written by Varda Pandey.
Members unlock every lesson across all six tracks and the complete archive of Market Notes.
Create a free account and read the first three lessons in every track, plus selected Market Notes.
Create a free account