Mini Chapter Ten
Strangles
- This is a cheaper variation of a straddle that involves going long an OTM put and an OTM call again usually structured as a net zero-delta option at inception.
- The cheapness however comes at the cost of both lower Gamma and Vega amounts as both strikes are out of the money. But note that theta would be lower too.
- Net delta in theory (in a zero skew world) should be zero as long as the option strikes are equidistant from at the money forward i.e. delta on put would cancel the delta on call.
- Delta hedging would be similar to that in a straddle though profits would be smaller because of the smaller positive gamma in the position.
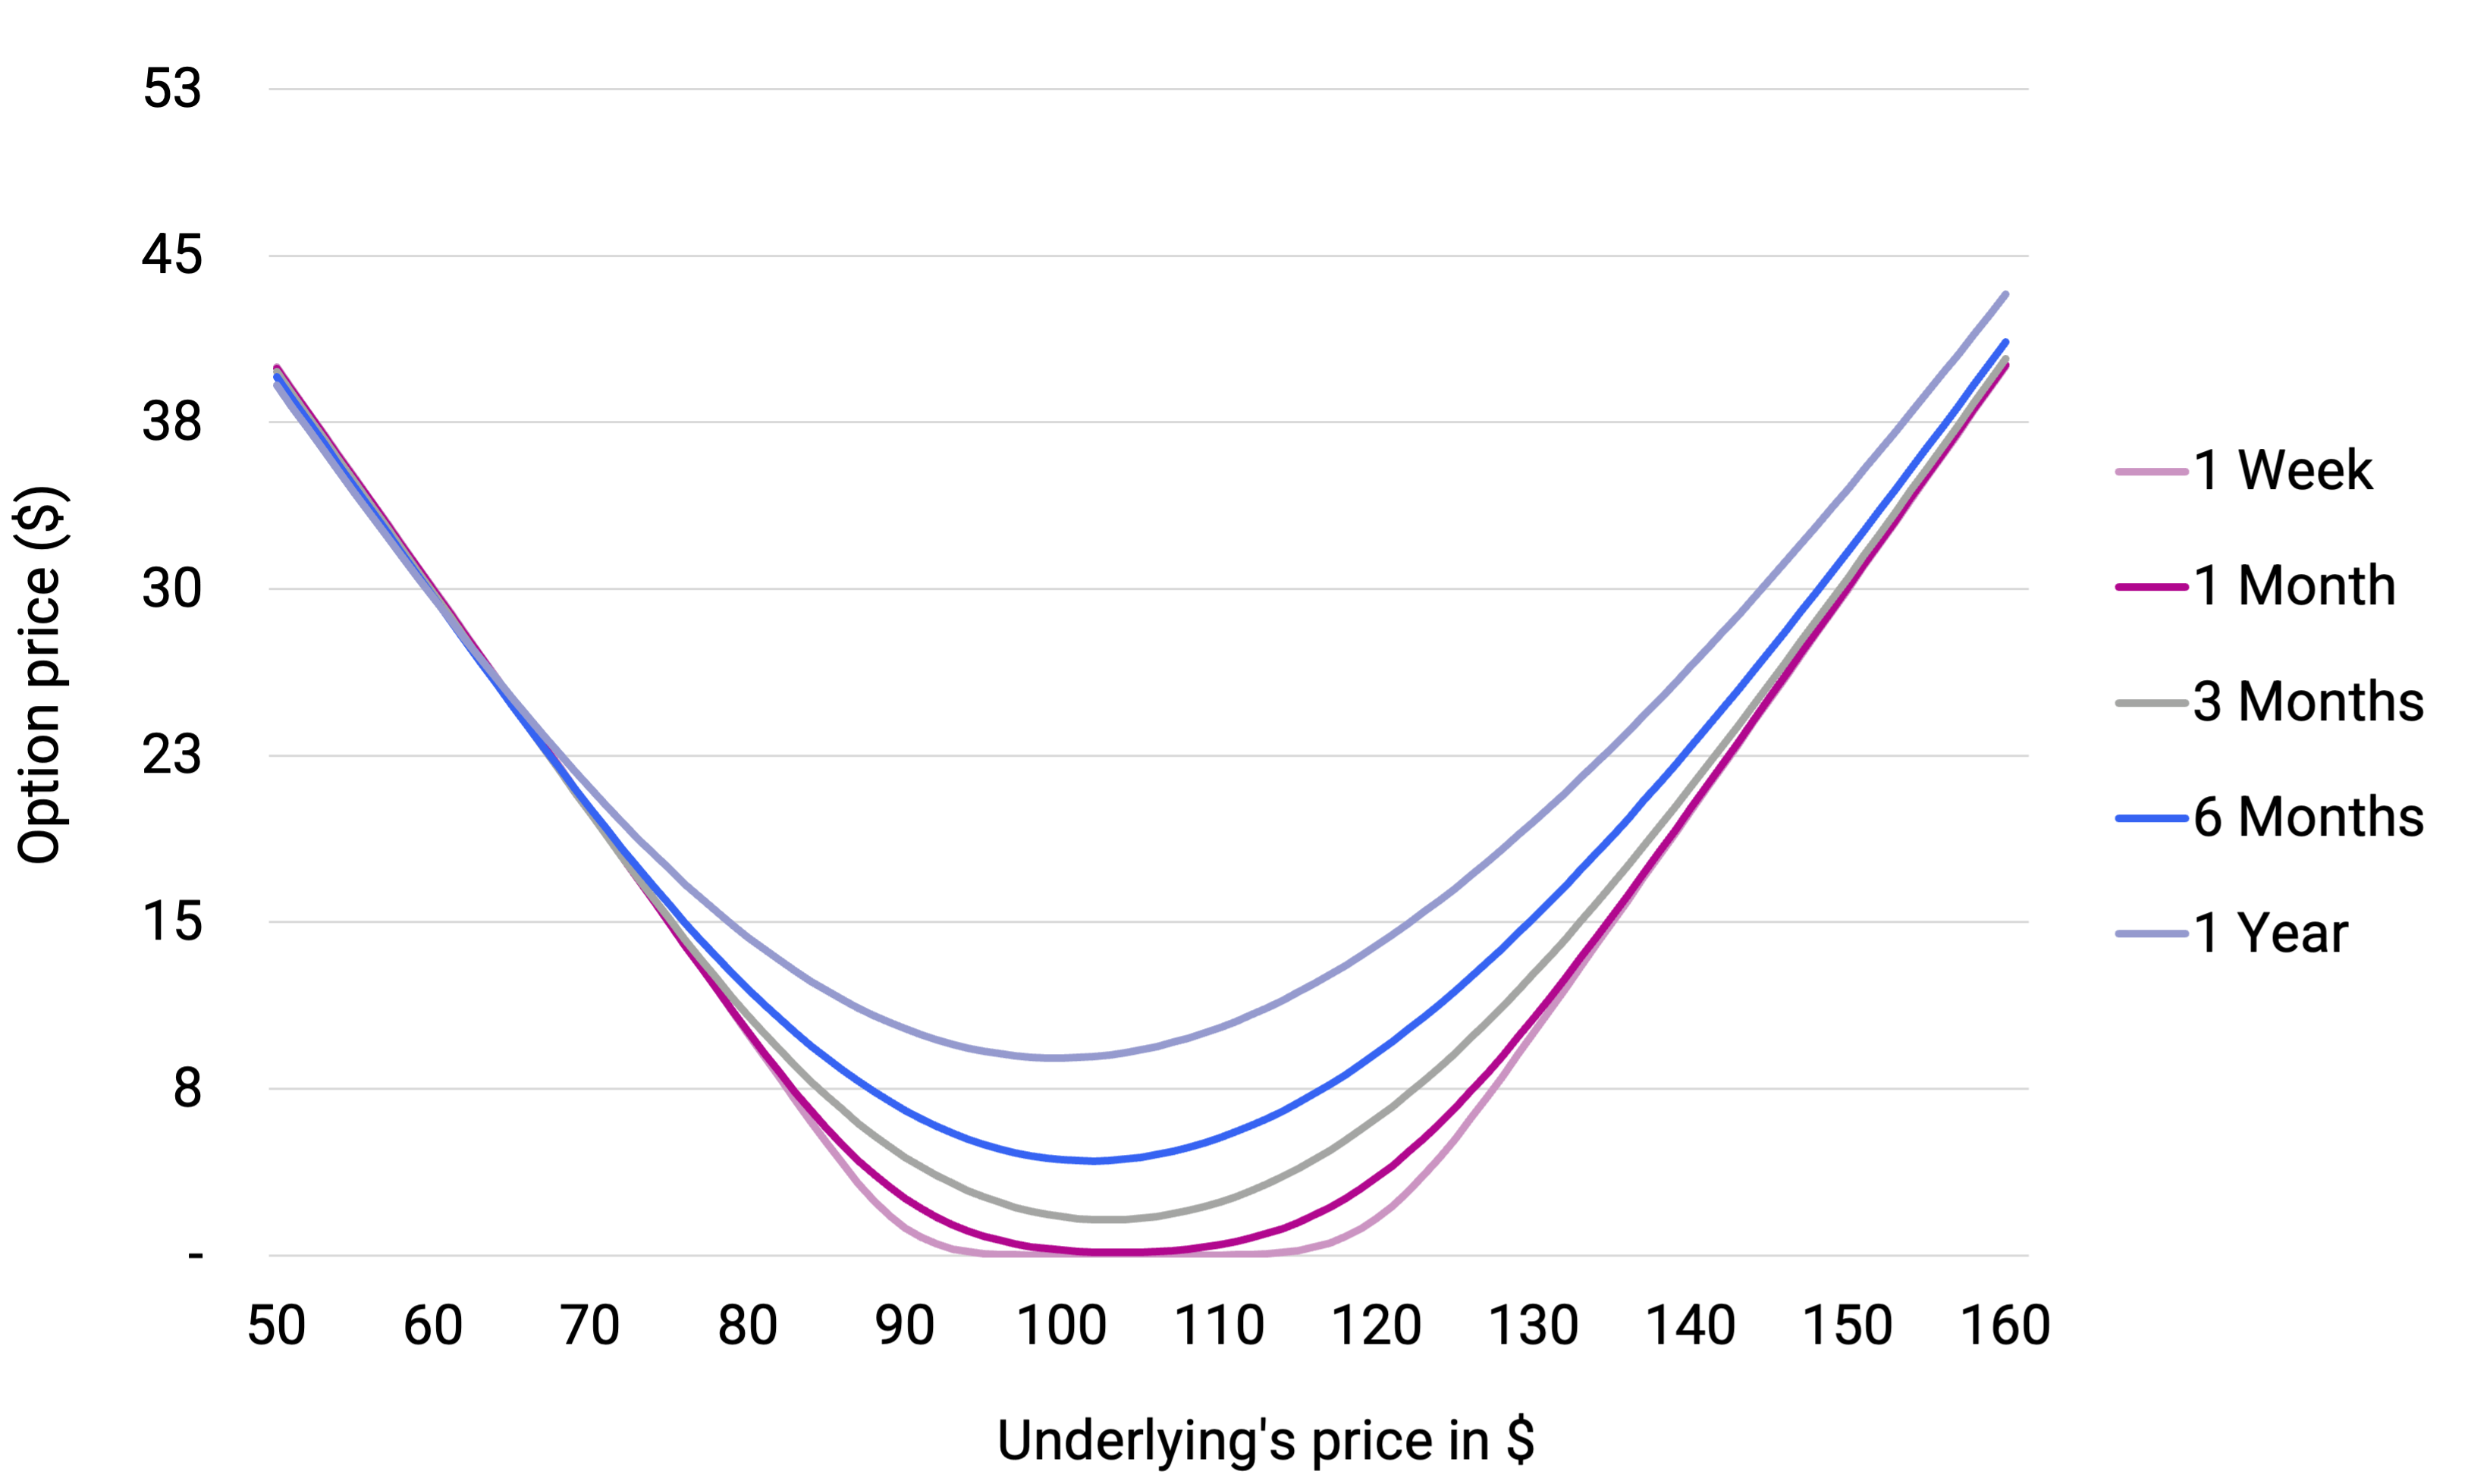
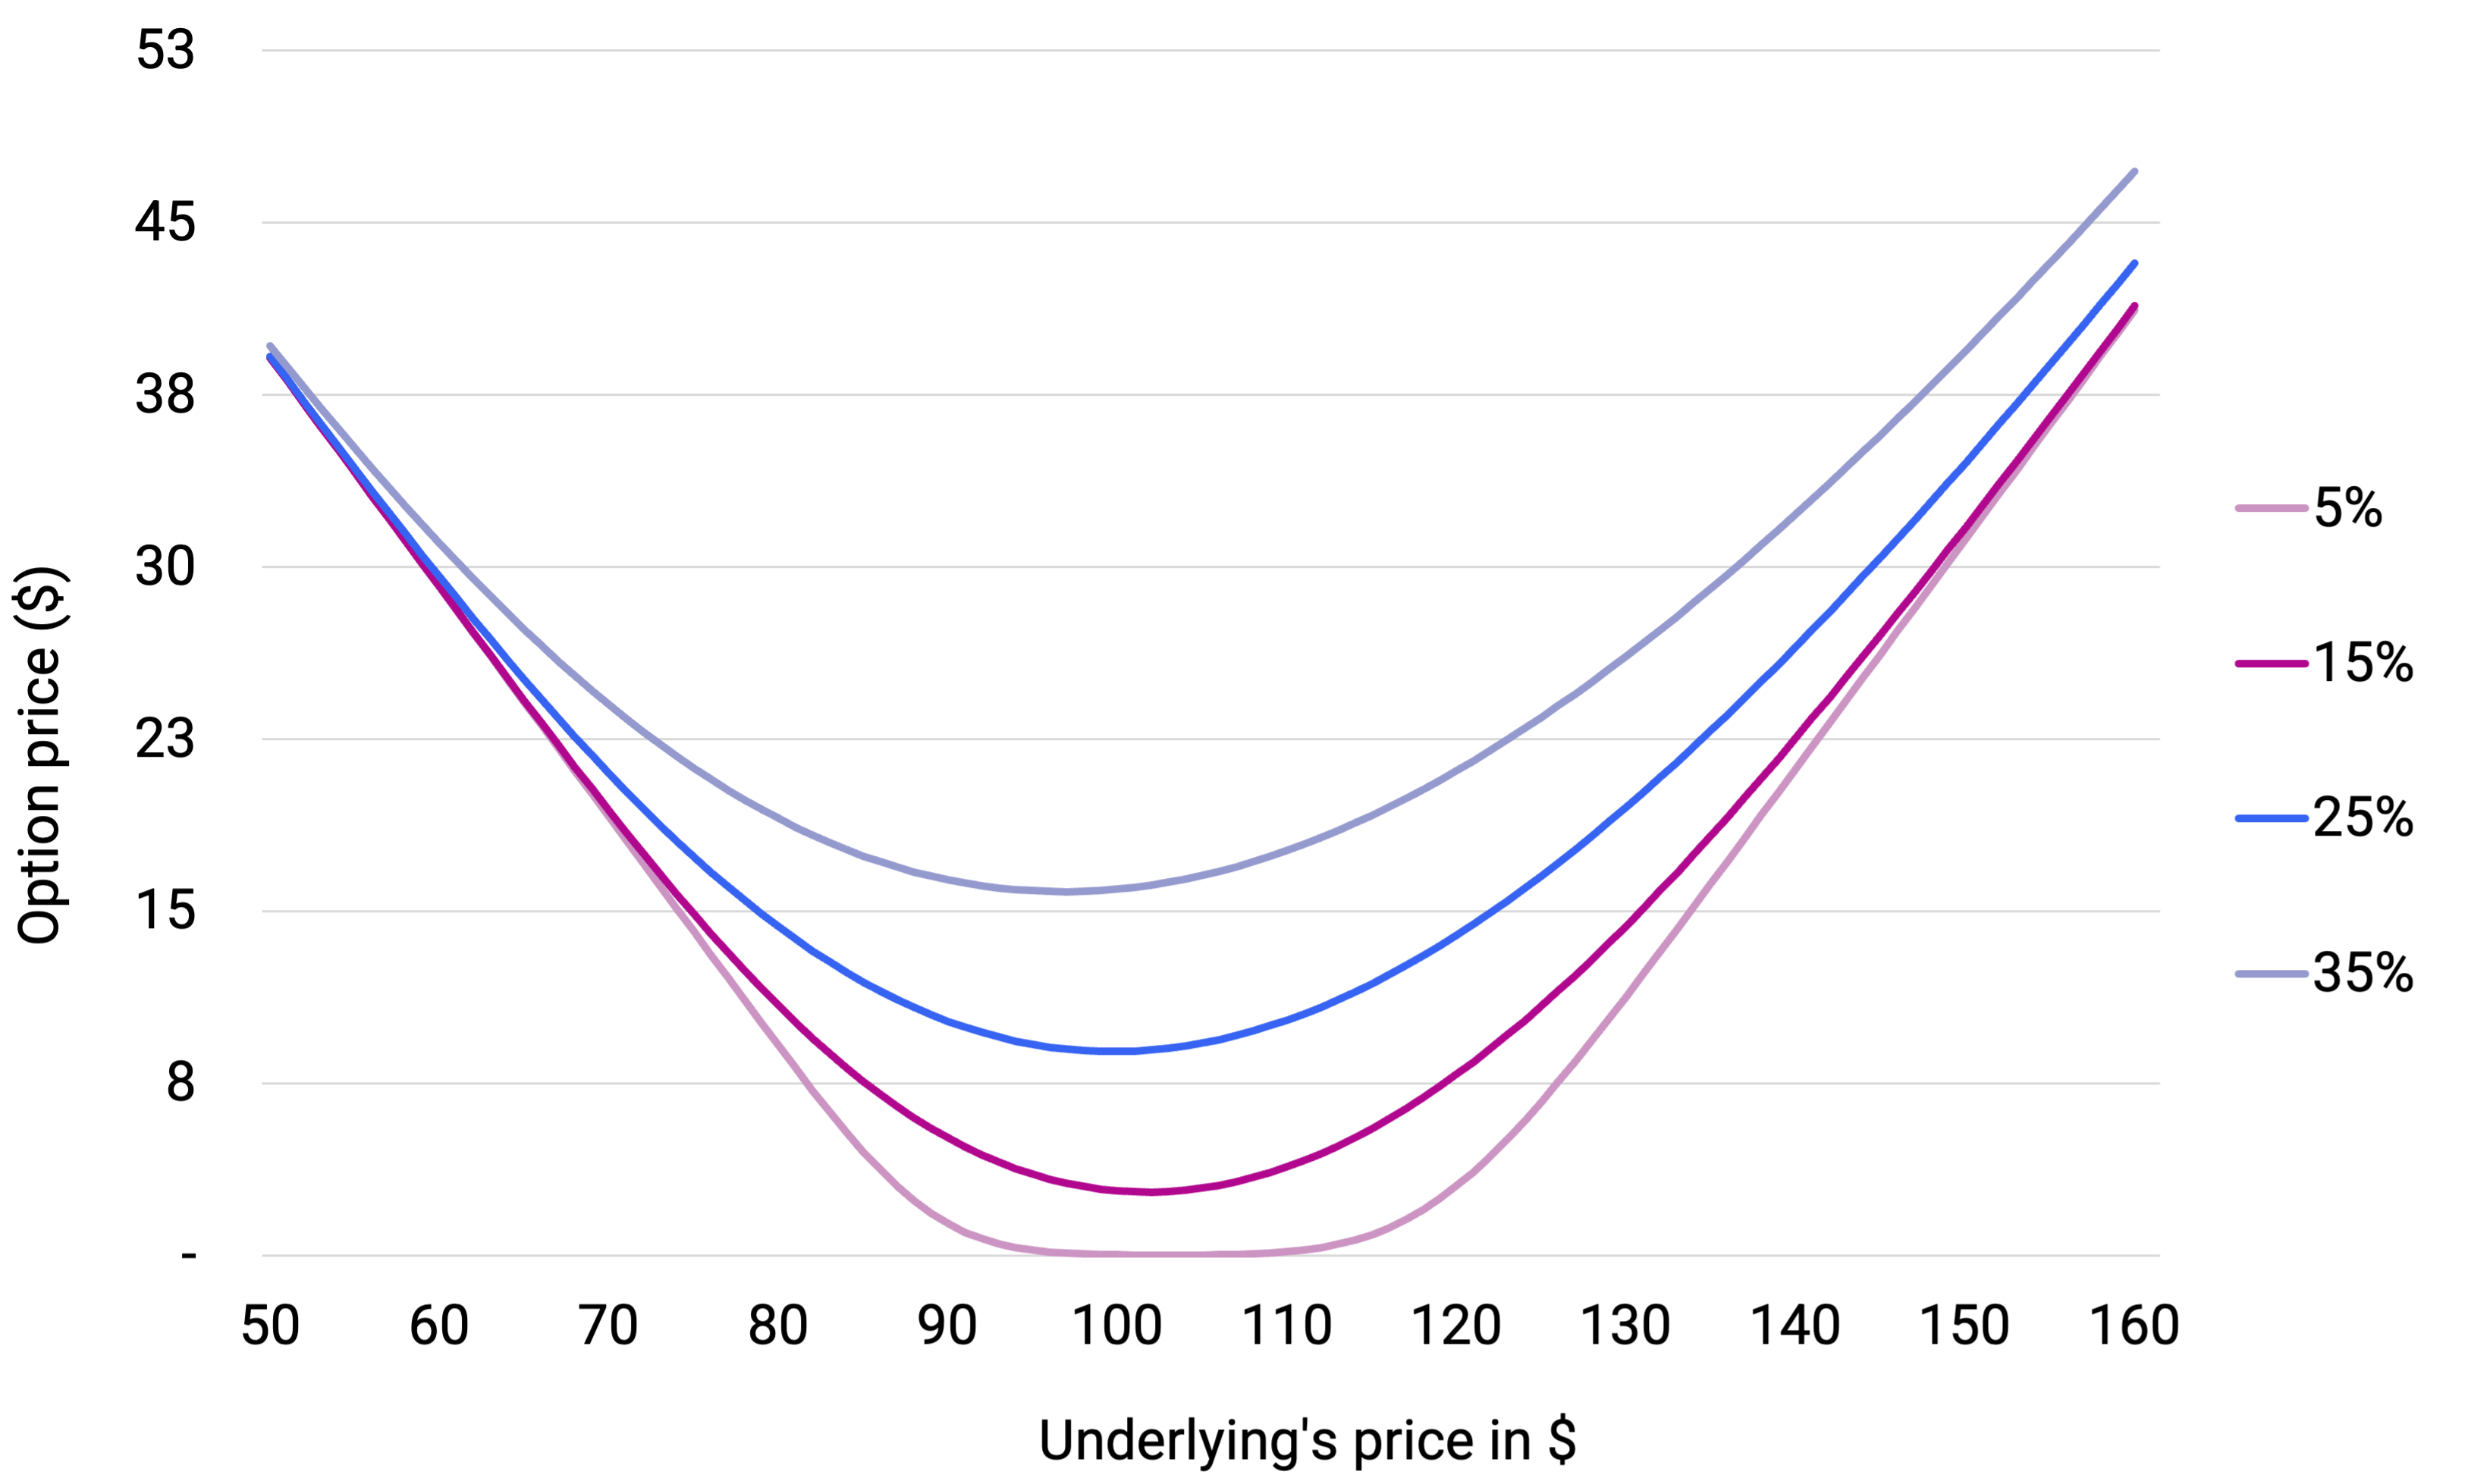
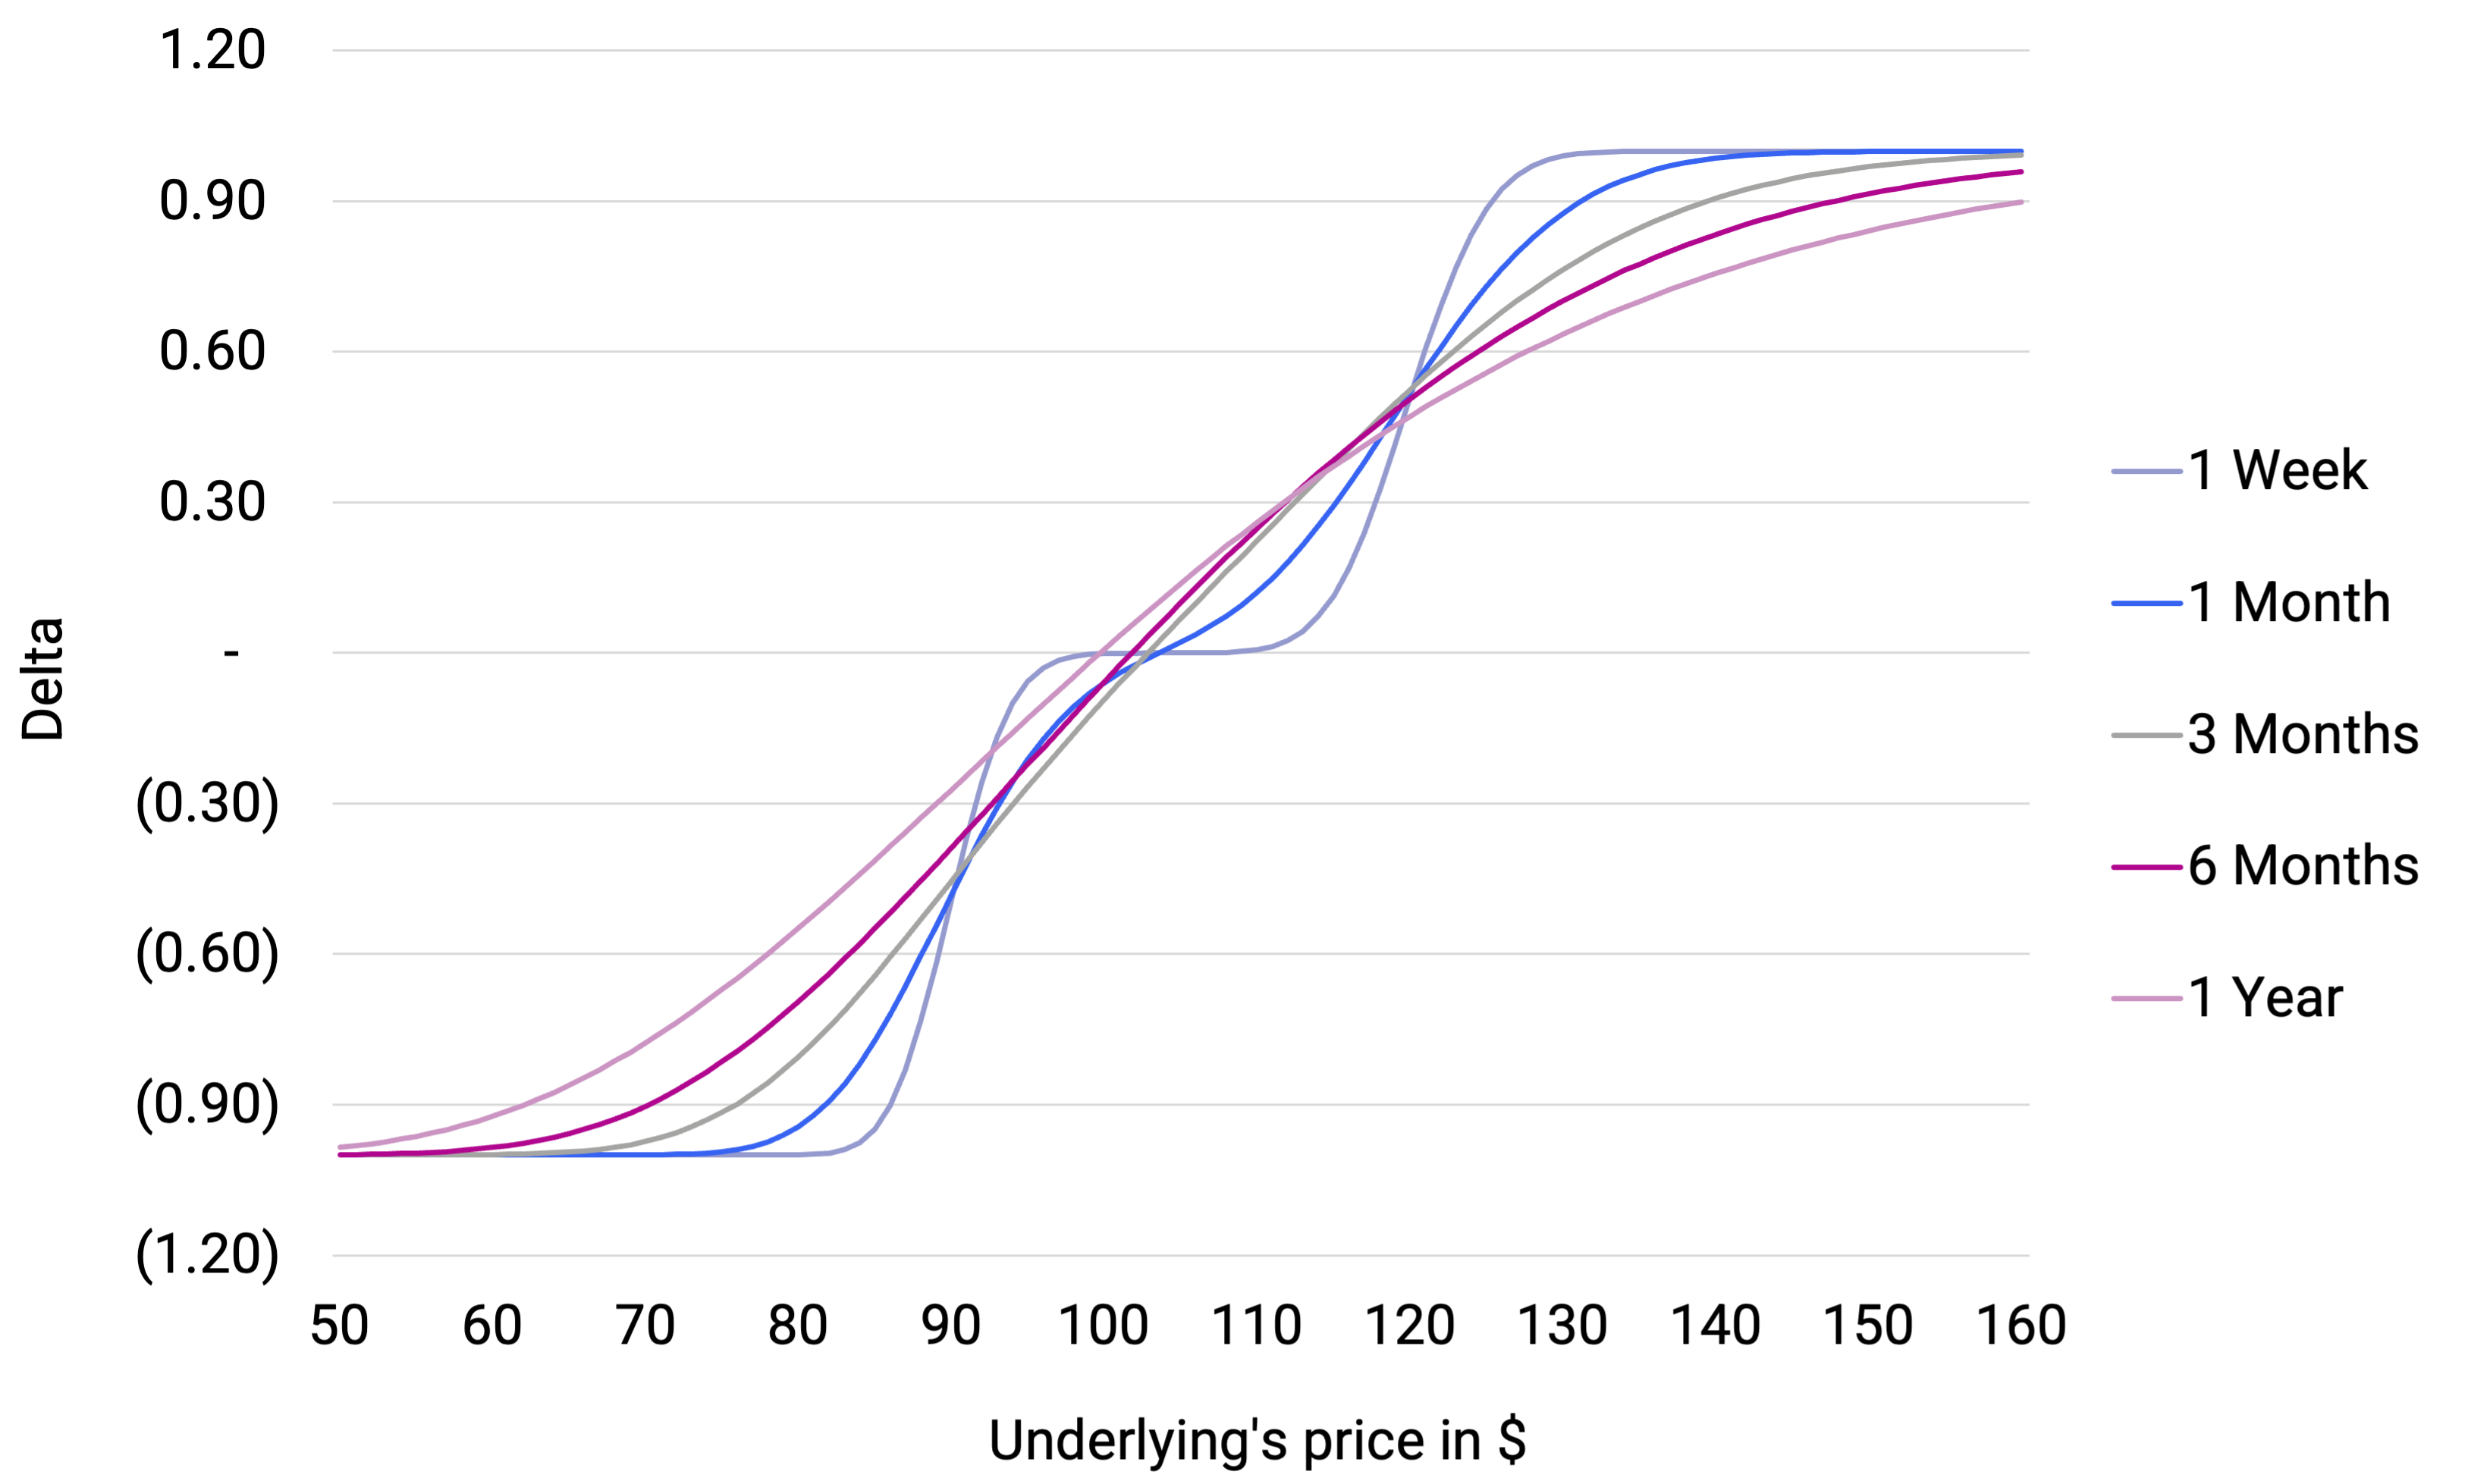
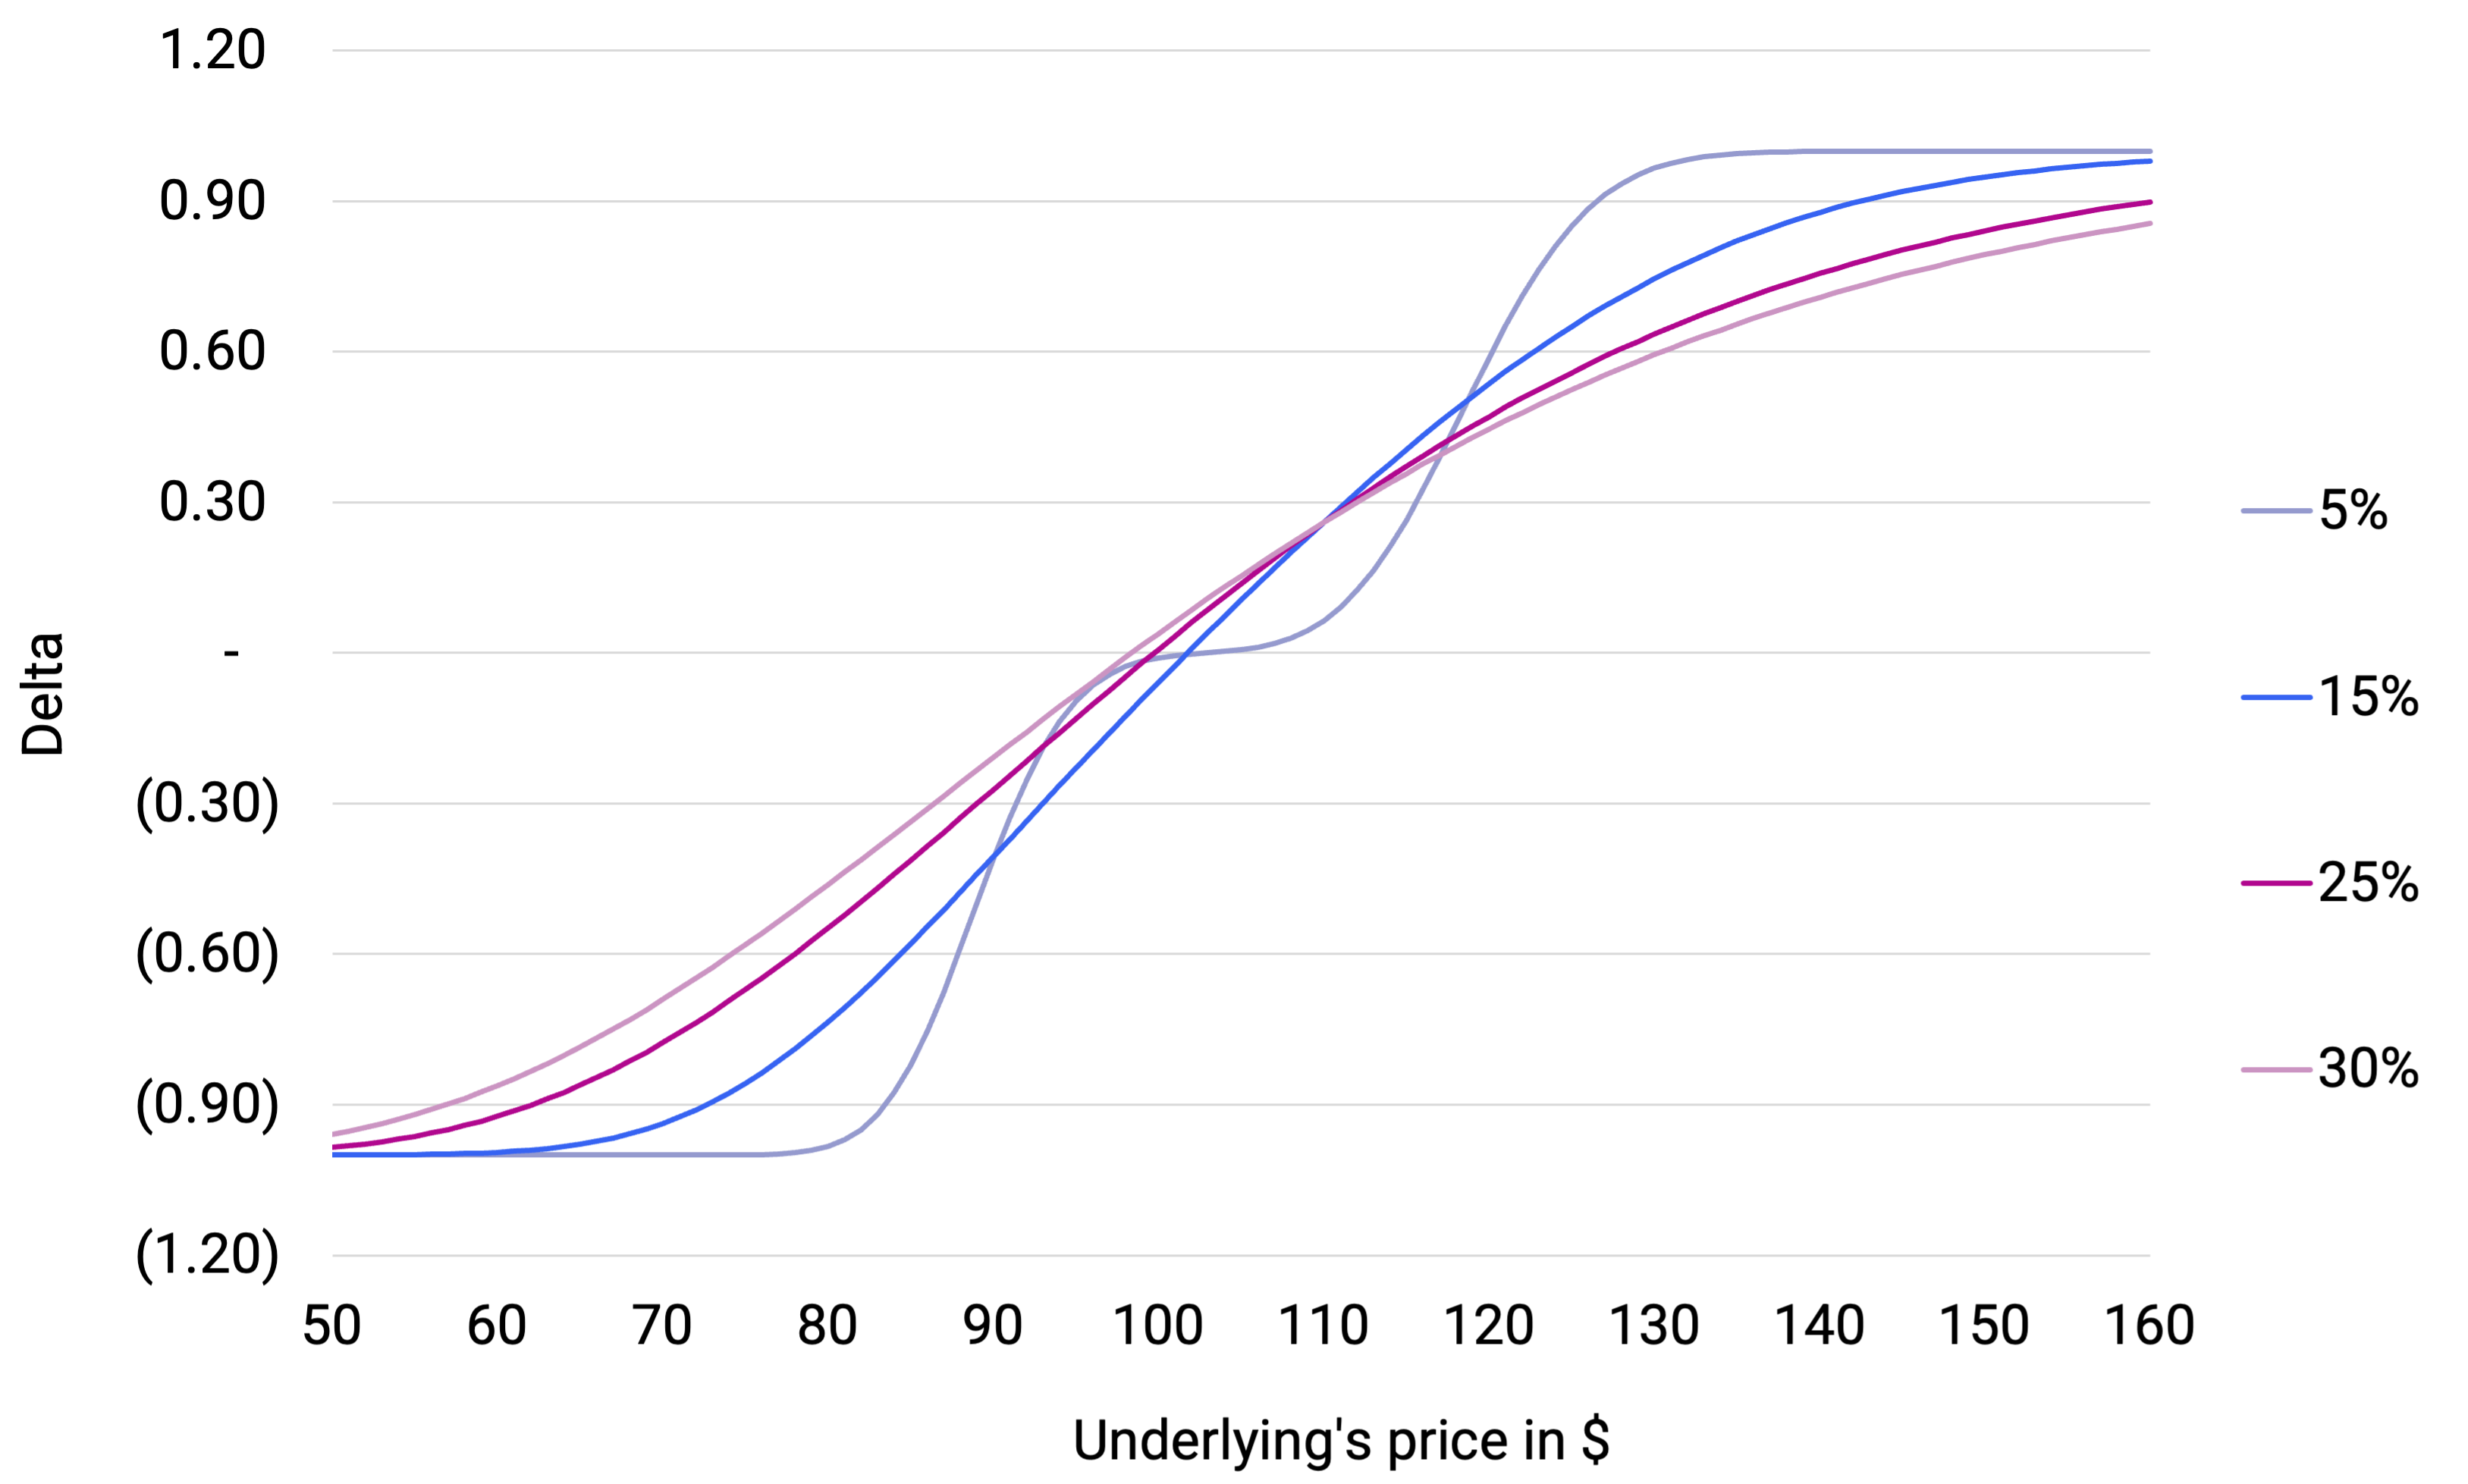
- Below is a depiction of the price of a 90×120 strangle and the related greek profiles for different option expiries and implied vol scenarios.
Graph 26 – Strangle price across Option expiries
Source: Pandemonium.
Graph 27 – Strangle price across Implied Vols
Source: Pandemonium.
Graph 28 – Strangle Delta across Option expiries
Source: Pandemonium.
Graph 29 – Strangle Delta across Implied Vols
Source: Pandemonium.
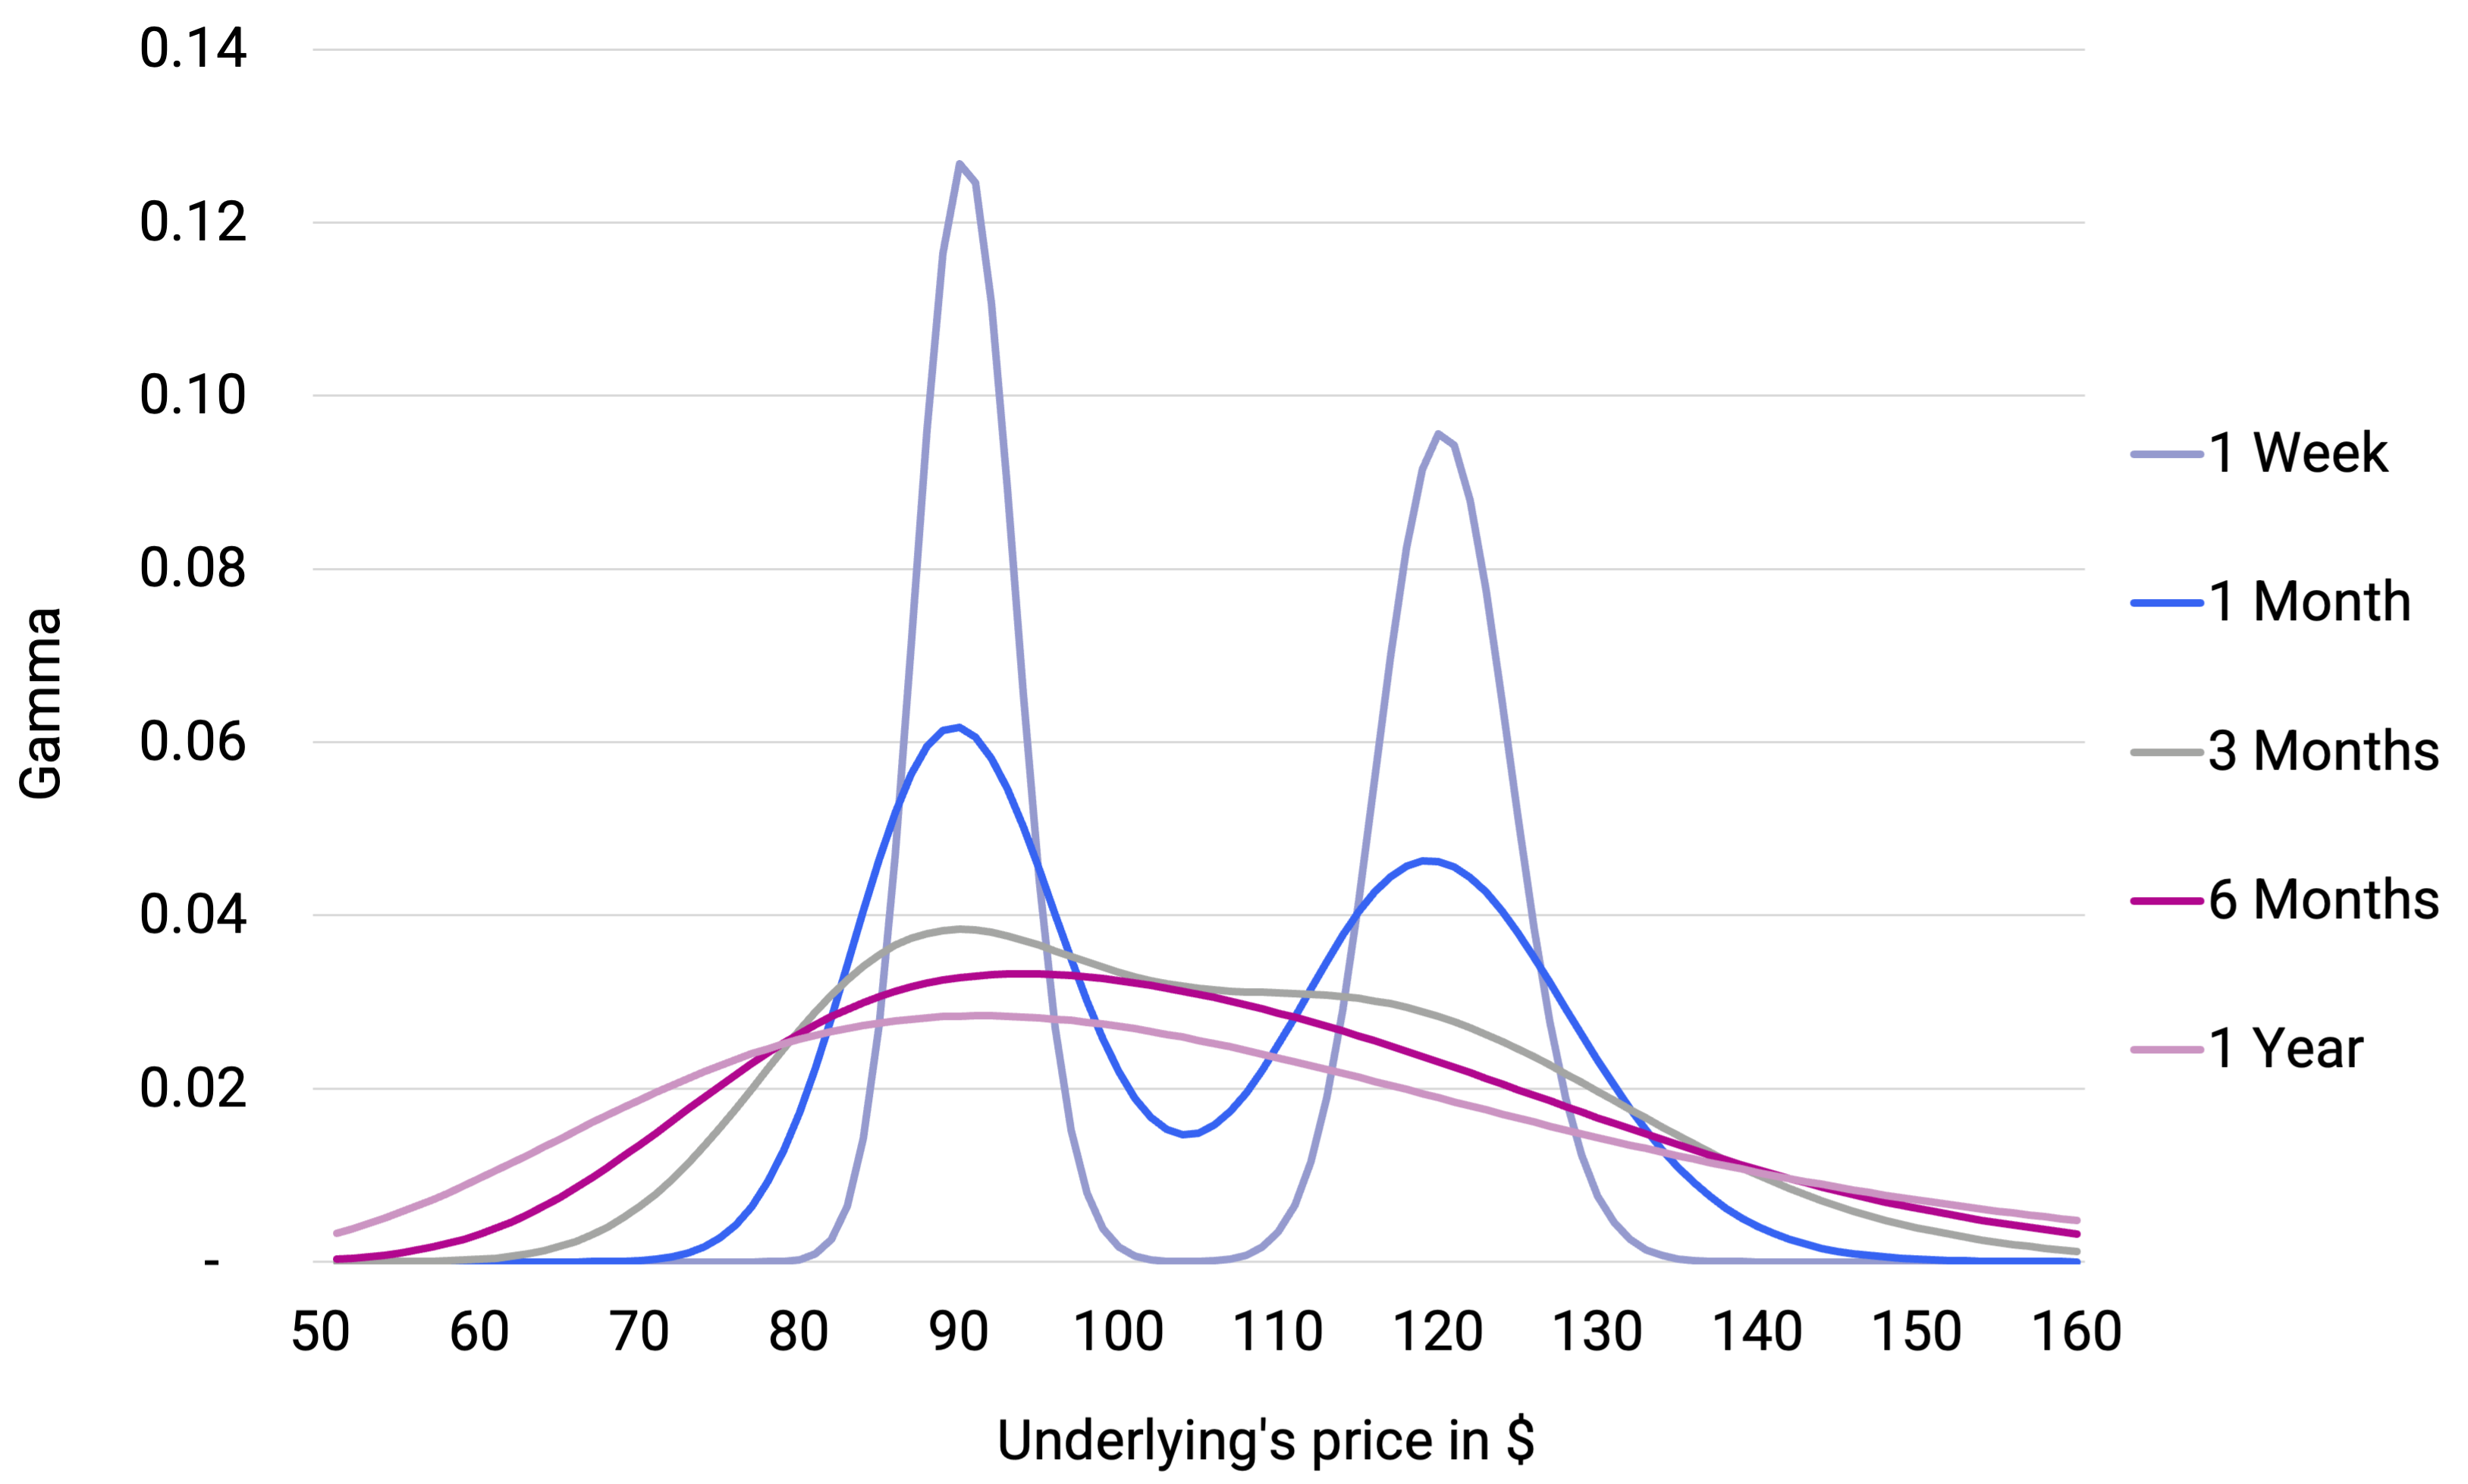
Graph 30 – Strangle Gamma across Option expiries
Source: Pandemonium.
Graph 31 – Strangle Gamma acros Implied Vols

Source: Pandemonium.
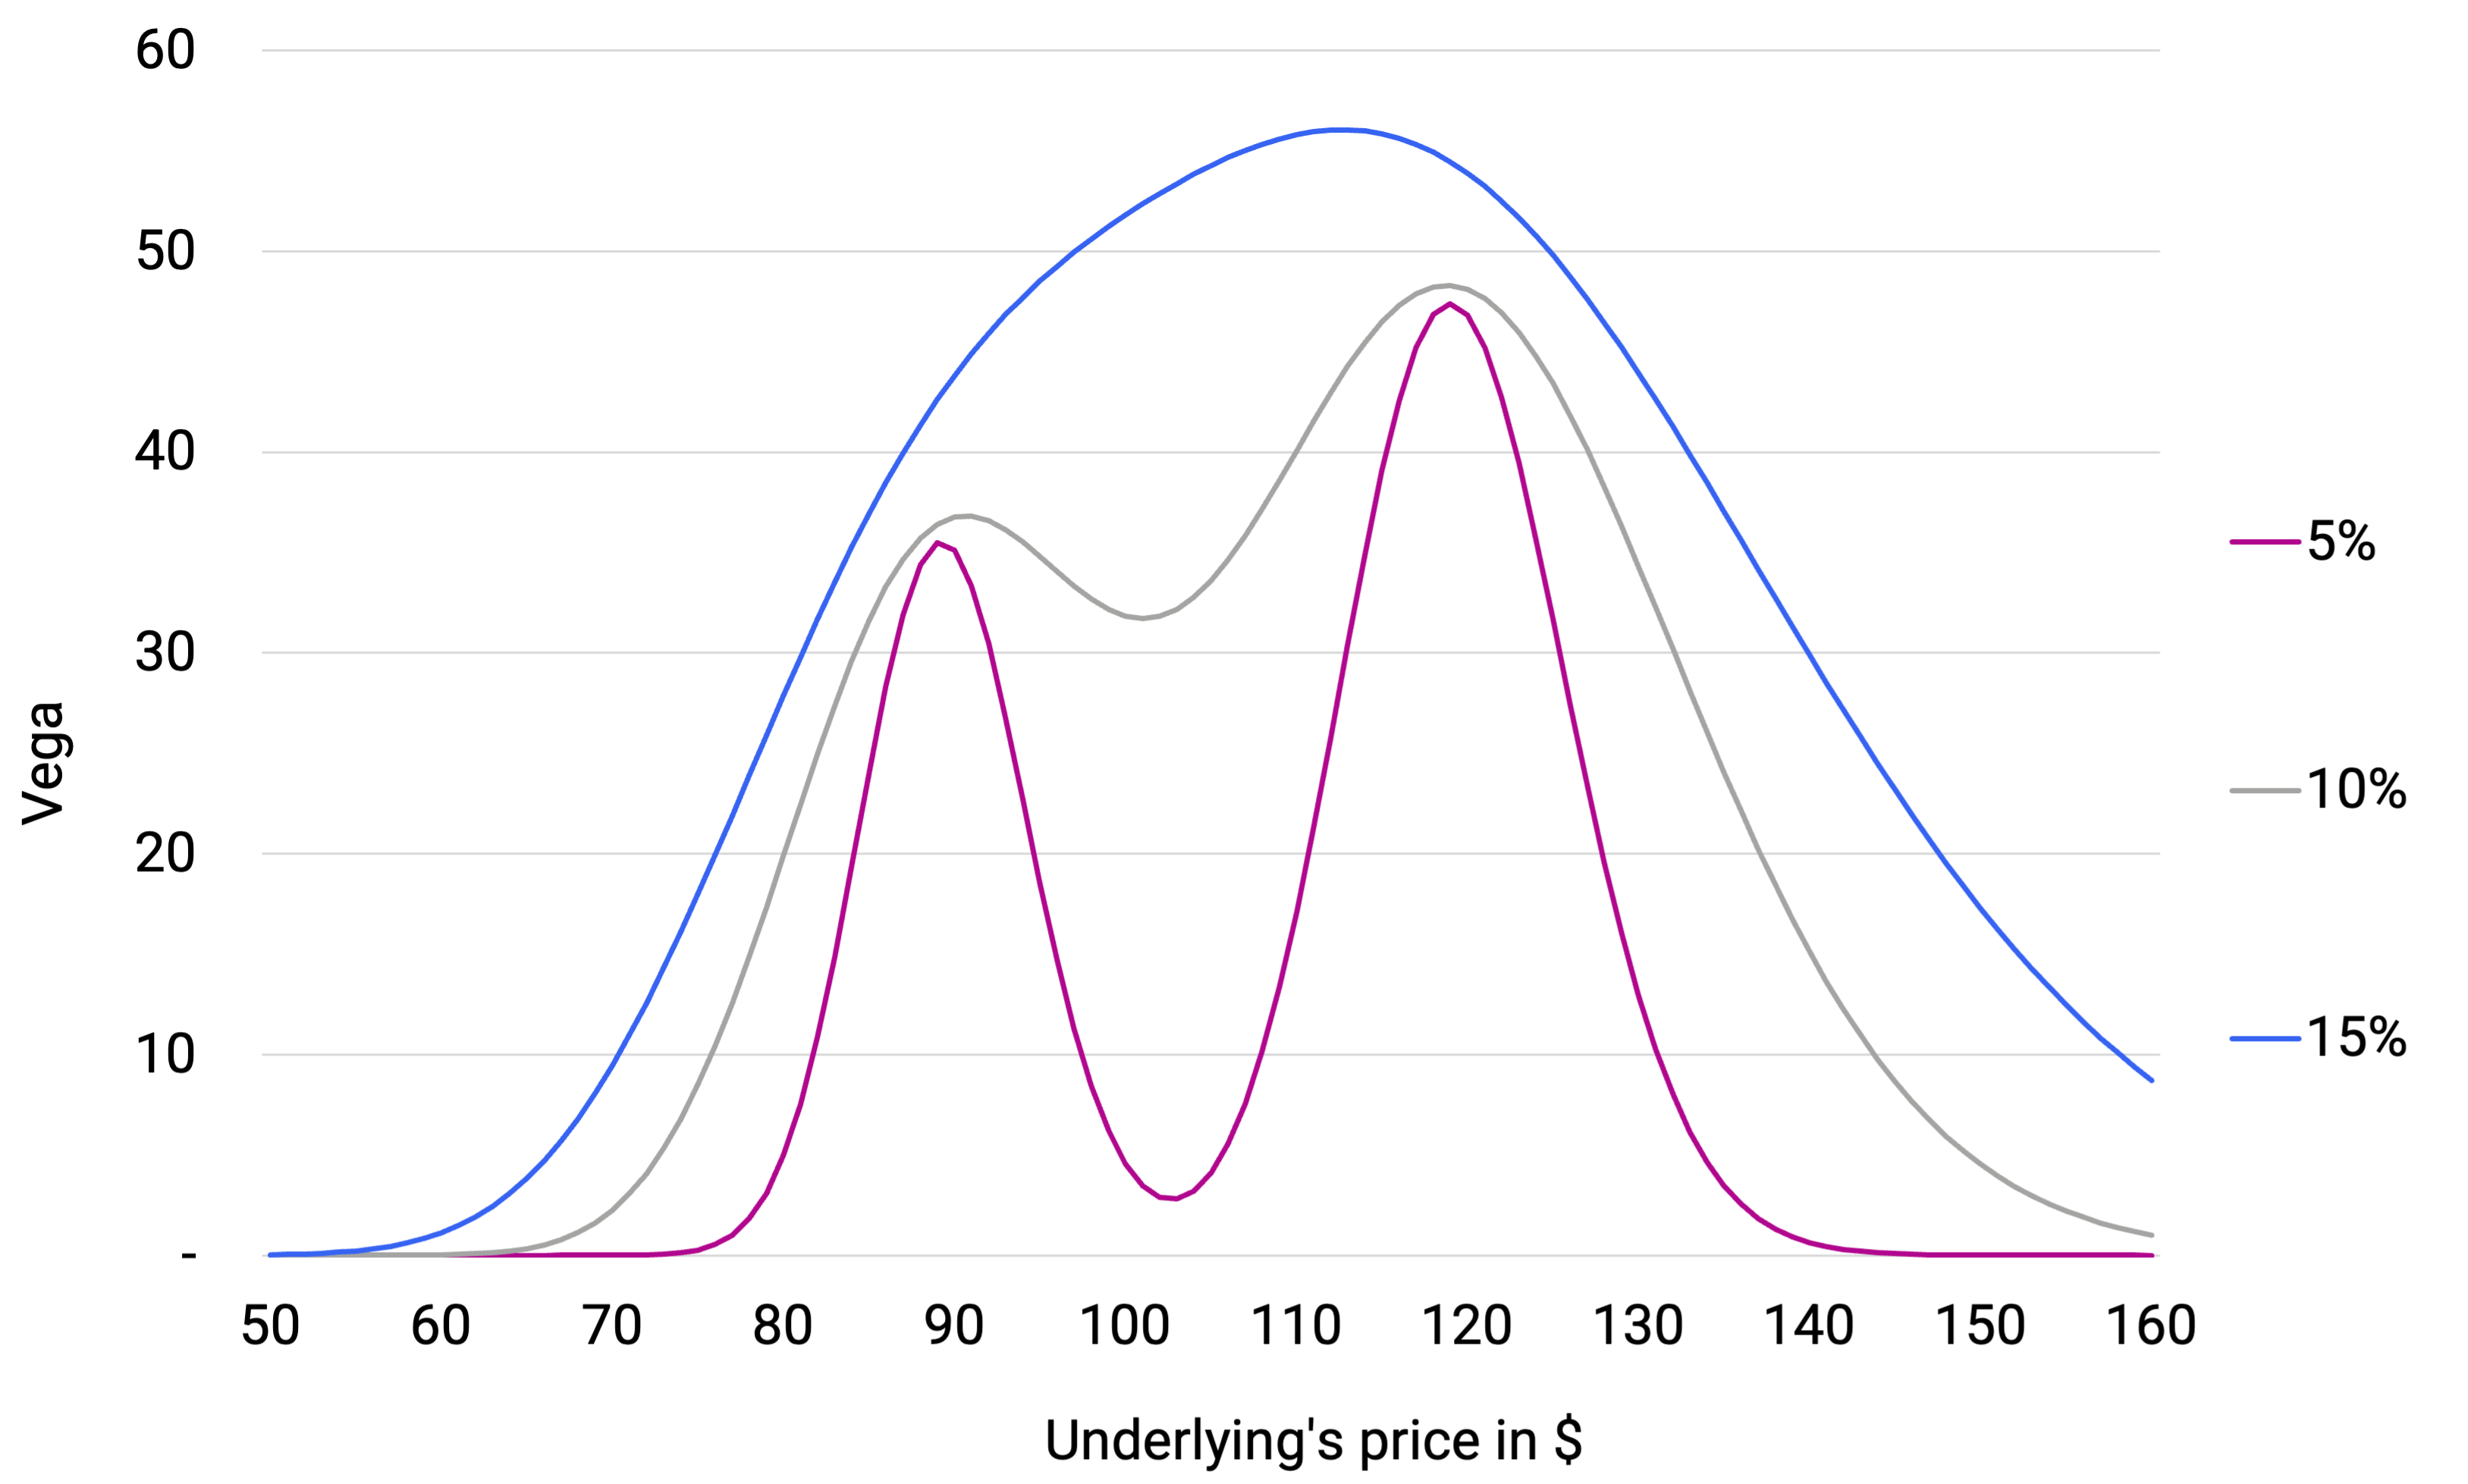
Graph 32 – Strangle Vega across Implied Vols
Source: Pandemonium.
- Delta profile suggests a near zero/zero value around the midpoint of the strangle range, imitates a put delta on the left of the midpoint and a call delta on the right of it given the respective long positions.
- Since the graphs plot a spot underlying and computes Delta, gamma on linear movements the profiles are not symmetrical around ATMF. Much like the discussion on the call option vega profile, the delta profile here is much steeper to the left of ATMF strikes and flattens out for strikes on the right of ATMF. Similarly for the gamma profile (derived from delta moves), it’s understandable that the left hand peak is higher than the right hand one.
- Given that the vega profile stretches out to the right (slower to decline as explained earlier), the right hand peak is higher than the left hand one.
- All of the above should be true for any long option strategy but they are easier to appreciate for a strangle where strikes are well spaced out.


