Part 1 - Asia in Focus – what do markets tell us about monetary policy divergence?
Part 1 of the Asia macro series unpacks the rates-versus-FX-vol dynamic behind the carry trade, why coordinated global tightening suppressed Asian FX volatility, and why fears of monetary policy divergence may be overdone.
The short version
Varda Pandey
Author
June 7, 2024
LISTEN · NARRATED
0:00
0:00
1x
Login to Listen
Rates and FX vol interplay is an intriguing nuance as we head towards a much-awaited dovish Fed pivot
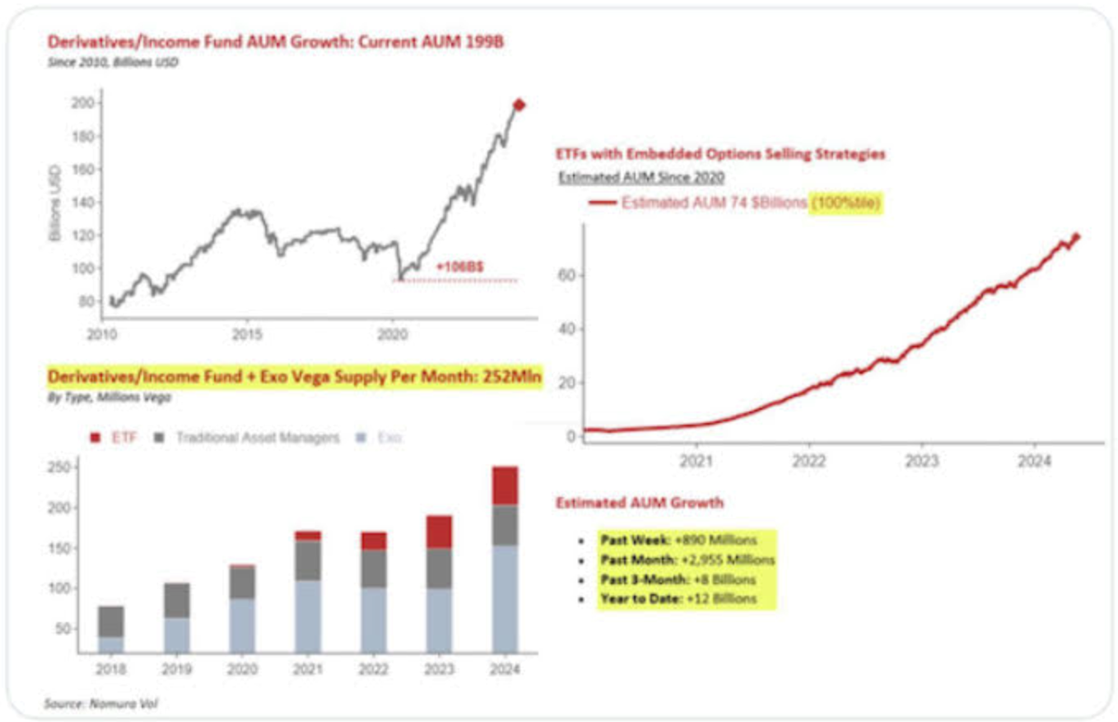
In my previous blog post we discussed the growing popularity of carry trades that analogously shows up as selling of interest rate vol especially as it's been the highest across asset classes. The trade has gotten bigger each passing week, reinforced by a range-bound play on DM yields. This snapshot of short-vol expressions put together by Nomura at the end of May caught my attention – derivatives income fund with embedded short vol strategies have doubled in AUM over the past four years, supplying vega north of USD 250 mio every month!
What does that mean for the urgency of attaining Fed's 2% inflation target? – seems like the best in terms of hawkishness we can manage from the Fed Chair is to express more patience before the first rate cut i.e. the last mile can be slow and steady stretching well into next year. Recent inflation data has reinstated faith in the progress of disinflation but there's no doubt that the trajectory is vulnerable to any supply shocks or even demand shocks (a more credible policy support for China's growth, anecdotes already suggest a bottoming) ahead. Recent weakness in manufacturing data (no matter how questionable and relevant for a tech driven economy) can argue in favour of current interest rates being restrictive enough but let's remember if 2%+ inflation prints run well into its fifth year, higher inflation expectations can further shorten the magnitude of cuts in this cycle. Add to that a Trump presidency and bond vigilantes would be in for a feast as higher term premia rips through the 'carry calm'. Have you hedged with the payer spreads yet?
The Fed can have a stealth stance for a 2%+ inflation target when it talks about conditions for rate cuts, but markets have been unabashedly receptive to their communication with the short vol trade. For now, we are in a sweet spot for carry players to make merry across products and regions. Key message of this write-up is as long as the next Fed action is a rate cut, even in a higher for longer backdrop we may see growing preference for local currency emerging market carry. Asia stands out in this regard, and we would discuss why. A soft landing for US with rate cuts of no more than 150bps, would amount to stunted cutting cycles for Asia EM as well i.e. long bond bets would gain less from rates alpha but more from steady/low vol coupon incomes, FX-hedged to begin with.
I'll break down this article into two parts – first part would talk about the Rates vs FX Vol dynamic to better understand the current long carry framework, while second part would talk about virtues of Asian Macro and markets in the present environment. Let's get cracking!
Periods of no/minimal policy divergences – most Asian economies are in their third year of a restrictive monetary policy (Korea is in its fourth year) but it's safe to say that pricing of a coordinated policy tightening across CBs happened at least two quarters ahead of the first Fed hike in March 2022. The chart below is interesting (apologies for multiple panels) and deserves most of your reading time for this piece. I'll elaborate on each panel below:
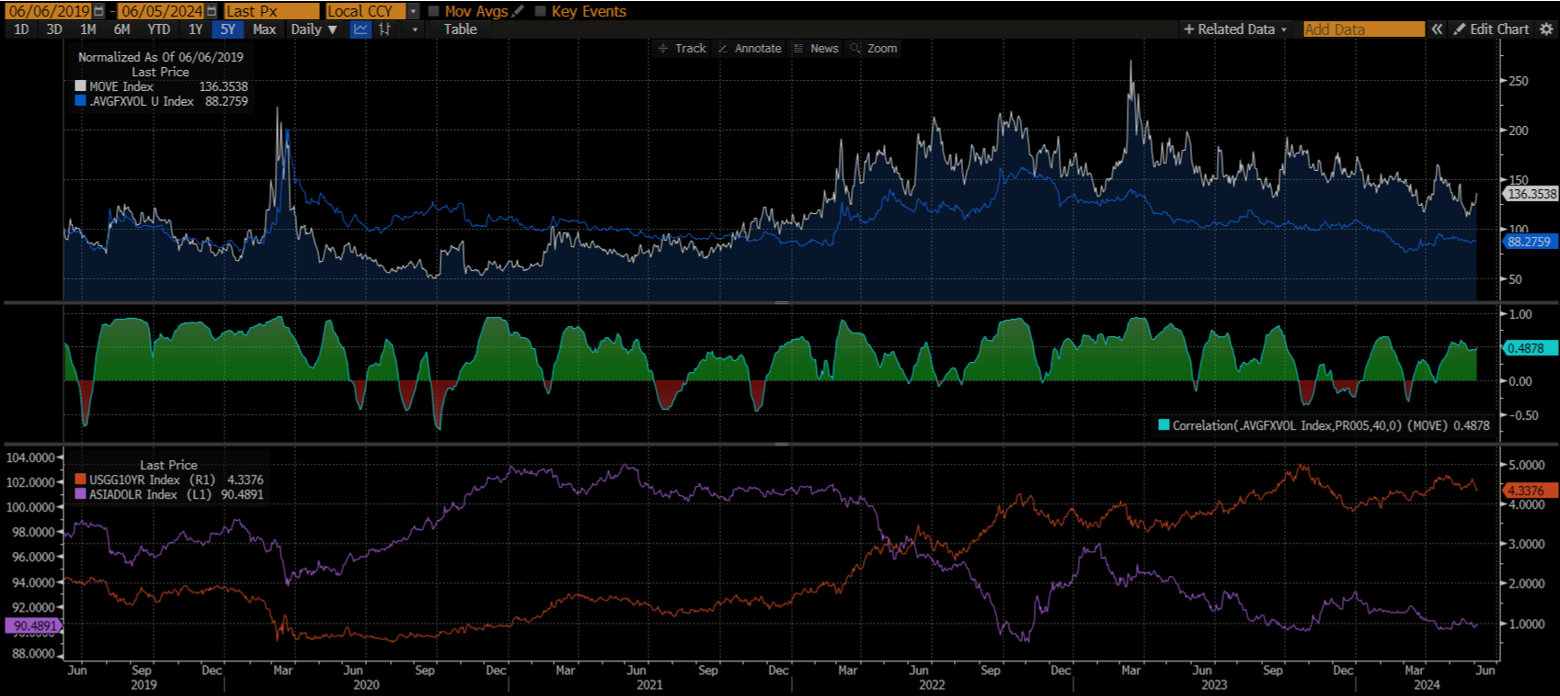
US Bond vs Dollar Asia FX Volatility for the past 5 years
Panel 1 – US Bond Volatility vs Average Dollar Asia FX volatility – I've used BOFA's MOVE Index (white line) to represent broader US rates volatility and taken the average of 3m ATM implied volatility of five Asian FX pairs – USDCNH, USDINR, USDKRW, USDSGD, USDTWD – to have a composite vol index (blue line). The two data series have been normalized for a like to like comparison.
Panel 2 – Correlation between Bond Volatility and Average Dollar Asia FX volatility
Panel 3 – 10y UST yield (red line) and Bloomberg's Dollar Asia Index (purple line) juxtaposing absolute levels for a clearer analysis
Here are some thought provoking observations:
Dollar Asia FX vol is above US Bond vol (blue line above the white line) during the March 2020 to September 2021 period, with maximum divergence till about Feb 2021. That's the covid shock period defined by enormous amounts of liquidity injected by the Fed suppressing bond yields and weakening the USD. The lines flip (bond vol above FX vol) Sep 2021 onward up until now i.e. when the inflation blow-up fears gripped market sentiment and yields started adjusting higher. Note that in both cases there's an event shock and expectation of coordinated monetary policy actions of easing and hiking.
So what's the dynamic of the two vol curves? – interest rate vol is a function of the absolute level of rate/yield while FX vol reacts to either an external shock as described above or a stark monetary policy divergence which ECB's much awaited rate cut today might validate soon.
Despite the inflation shock why did FX vol report a secular decline? – coordinated (and unprecedented) policy tightening has been the overwhelming narrative for markets over the past couple of years, which not only pushed rates vol significantly higher, but once supply-side inflation pressure subsided towards the end of 2022 so did the overall shock component. Barring the short CNH and short JPY play (both driven by growing policy divergence between Fed tightening and PBOC/BoJ accommodation) the higher for longer narrative so far hasn't created any policy divergence between US and other Asians. That should explain the move lower of the composite Asian FX vol index.
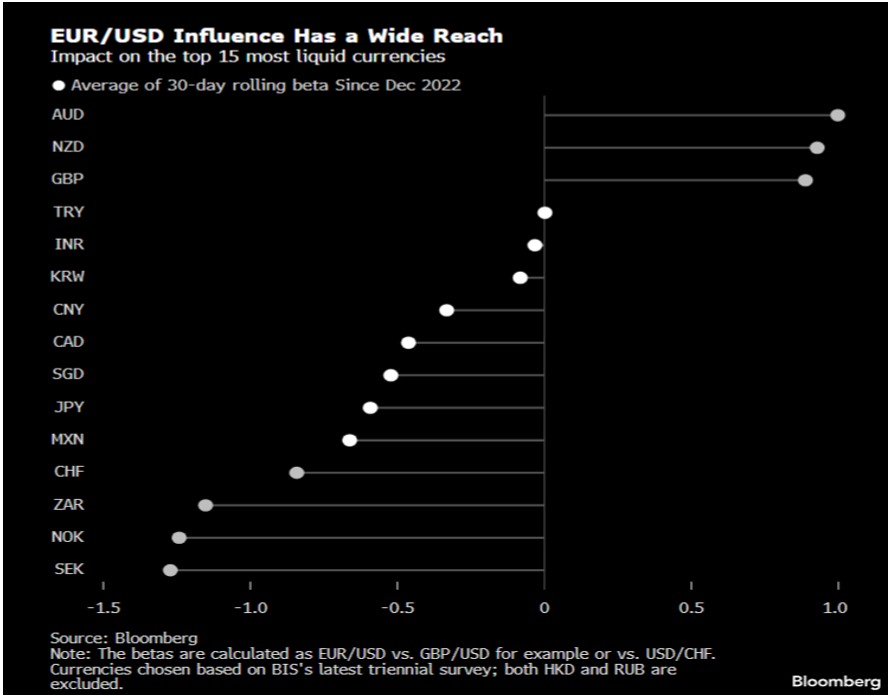
Fed-ECB policy coordination so far has suppressed EURUSD Vols over the past 18 months which has impacted other liquid currencies too depending on their respective betas. The much anticipated (and priced) ECB rate cut delivered earlier this week while on paper has initiated a divergence from the Fed's interest rate policy, the accompanying hawkish guidance non-committal to immediate further easing reverted to alignment with the broader data-dependent, higher for longer narrative. FX vols ticked lower in response, and ECB's higher inflation estimates for 2024 and 2025 made its first rate reduction looked nothing more than a promise (from their March meeting) they had to keep.
Takeaway from the correlation panel is just as simple as – periods of USD weakness coincide with a drop in correlation between rates and FX vol. This can be intuitively reasoned – USD weakness is generally met with lower FX vols and lower yields, unless it's a shock driven flight to safety drop in yields in which case USD strength and higher Asian FX vols can be expected (SVB's failure reported on Mar 8 2023, case in point). Periods of low/negative correlation are more prolonged when USD weakens on low absolute level of yields, while they are more short-lived in case of USD weakness at higher absolute level of yields like in the current backdrop.
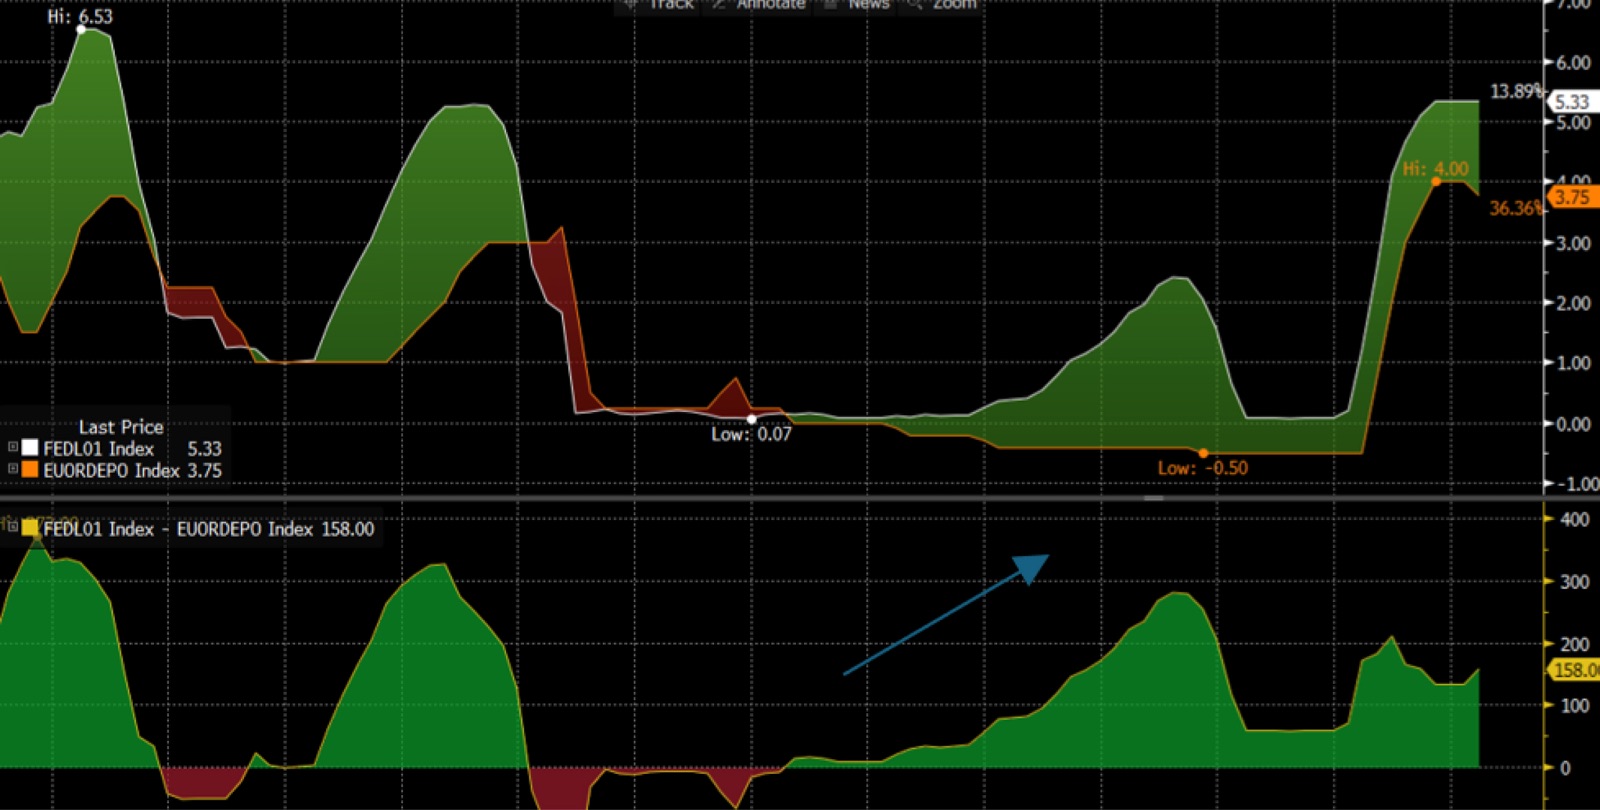
Lastly, the degree of impact of policy divergence is also a function of the starting point of the divergence i.e. after over 2 years of coordinated rate hikes our starting point is at 4% for the ECB and 5.25-5.50% for the Fed. This is a lot tamer than the ECB-Fed divergence observed during 2015-2018 period where the European CB was resolute to pound rates well into the negative territory while its American counterpart was shaking the system out of a decade long zero-rates regime. The psychological impact of a negative versus positive regimes and the widening rate differential (as marked in the picture below) is far harder to predict and prepare for.
Effective Federal funds rate and ECB's Deposit Rate
Today's circumstances are much different on the following counts:
Even though US inflation has had a higher (and stickier) demand-led component in it, inflationary pressures for the Eurozone may keep the 2% target from being attained for just as long as it would take for the US economy. Despite their different characteristics, inflation trajectories towards the 2% goal may be similar.
Periods of USD strength are expected to be erratic and short-lived as markets waver between one to two Fed rate cuts in 2024, erring on the side of a third one if hard macro data (more importantly jobs) continues to surprise negatively. This should keep the broader FX vol complex in check.
Imported inflation concerns of policy divergence – we already have a hawkish guidance from ECB after their first rate cut this week, but if in theory we had to work with a dovish one imported inflation would still not have been a concern. Because 40% of European imports are denominated in EUR, every 1% depreciation of the euro would raise total import prices by just 0.3% a year, that would add a meagre 4bps to headline inflation as per ECB research. Energy prices being contained of course strengthens this narrative, but even a blow-up here may reverse/weaken some of the policy divergence today relative to the 2015 macro backdrop.
Markets have been short the EUR (more moderate exposure now) in anticipation of a divergence and yet the currency is about 14% stronger relative to USD versus the September 2022 lows. Savvy global asset managers would have executed portfolio reallocations away from EUR and or hedged EUR FX risks. Despite a more complicated financial landscape (eg. ringfenced capital structure/liquidity constraints for non-member banks in Europe), the global liquidity pool is a lot bigger than central bank balance sheets today to cushion any FX related shocks to the system.
Policy divergence fears may be overdone. Moving back to Emerging Asia that's still largely expected to take cues from the Fed, suppressed FX vols are an attraction for Asian Local Fixed Income. Part 2 to follow.