The short version
Unexplained wild short lived price swings on option expiries and underlying cash market don't bode well for broader market development. (For those well versed with India's options market and ODTE please jump to the section on Potential Risk loopholes)
India's ever booming equity options market can easily be touted as the third obsession of the country in addition to Bollywood and Cricket. Indian exchanges have facilitated the highest options contracts volume in the world since 2019 with National Stock Exchange bearing the crown for the largest derivatives exchange by far in terms of futures and options contracts traded.
Chart 1 – India boasts of the largest option contract volumes in the world

Each passing year however the crown gets heavier and likely harder to manage as the burgeoning derivative volumes have dwarfed cash markets volumes to potentially create an ecosystem rife for manipulation in the guise of speculation. Before we get into the specifics of potential risk vulnerabilities, let's understand the market structure:
Chart 2 – Trends in Average Daily Notional turnover in Equity options on exchanges (figures are in INR crore, 100 crore = 1 bio)
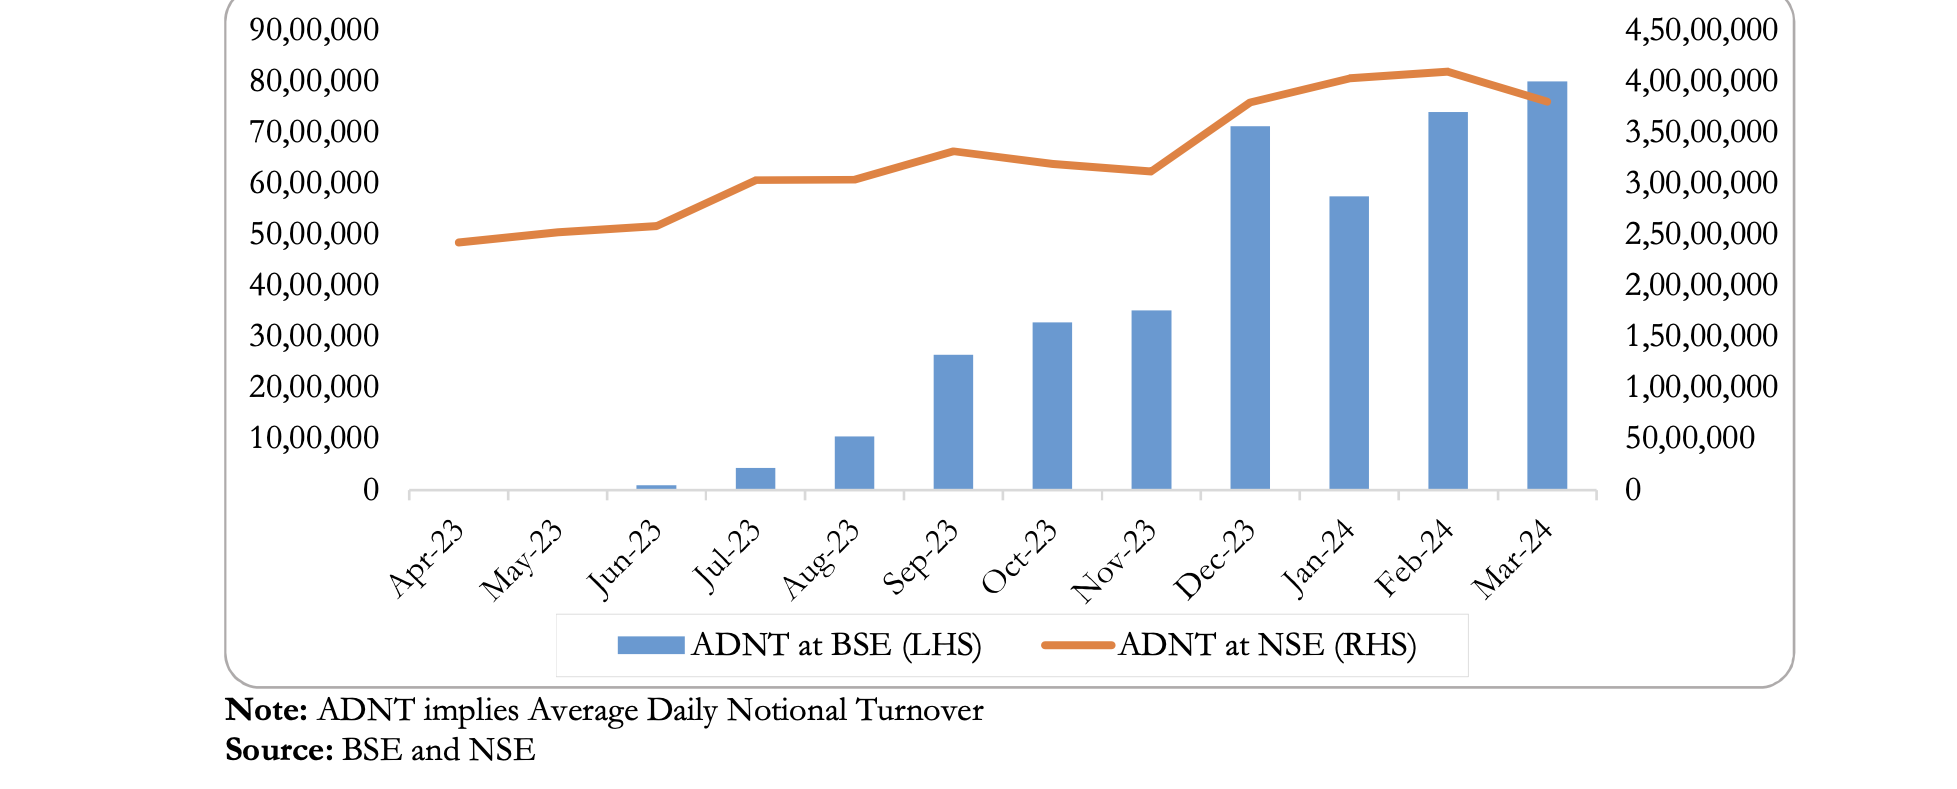
The chart above quotes average daily equity options notional traded on both the exchanges – for the 19 business days in March 2024, NSE recorded daily notional turnover of ~INR 380 trio or USD 4.58 trio while BSE recorded at ~INR 80 trio or USD 0.96 trio.
Chart 3 – Trends in Average Daily turnover in Equity Cash segment on exchanges (figures are in INR crore, 100 crore = 1 bio)

Here is a cross-country comparison of the derivatives (futures and options) to cash volumes ratio, apologies the chart is a bit dated (ending H2 2023) but the difference would be just as stark if not more as of today:
Chart 4 – Derivatives to Cash Volume ratio across countries

Cash equities interestingly have the same percentage of prop + others participation but the definition of 'others' is much wider to include partnership firms, AIFs, PMS clients, non-bank finance companies etc. to represent a more market savvy/risk-aware pool of investors relative to the options market.
Table 1 – Market Participants' share in equity derivatives across exchanges
| Category | NSE FY21-22 | NSE FY22-23 | BSE FY21-22 | BSE FY22-23 |
|---|---|---|---|---|
| Proprietary Trades | 34.8% | 38.0% | 83.50% | 75.30% |
| FPIs | 18.8% | 16.6% | – | – |
| Corporate | 8.4% | 6.3% | 2.30% | 3.60% |
| MFs | 4.5% | 4.1% | – | – |
| Domestic Institutions | 0.1% | 0.1% | – | – |
| Others | 33.4% | 34.8% | 14.20% | 21.10% |
Others category comprises of retail and high networth individuals. Source: SEBI Annual report FY22-23
Table 2 – Market Participants' share in cash equity across exchanges
| Category | NSE FY21-22 | NSE FY22-23 | BSE FY21-22 | BSE FY22-23 |
|---|---|---|---|---|
| Proprietary Trades | 27.5% | 27.2% | 33.9% | 33.1% |
| Domestic Institutions* | 2.3% | 2.6% | 2.4% | 3.1% |
| FPIs | 12.3% | 15.1% | 11.1% | 15.4% |
| MFs | 6.2% | 8.0% | 2.4% | 2.3% |
| Corporates | 3.8% | 4.2% | 4.6% | 4.5% |
| Others** | 47.8% | 43.0% | 45.6% | 41.6% |
| Total | 100% | 100% | 100% | 100% |
*Domestic Institutions (excluding Mutual Funds) include banks, Domestic financial institutions, Insurance companies and the New Pension Scheme. **Others include individual domestic investors, Partnership Firms/LLP, Trust Society, AIFs, Depository Receipts, PMS clients, Statutory Bodies, VCFs, NBFC etc. Source: SEBI Annual Report FY2022-23
SEBI conducted a study on the individual traders' profit and loss in the Equity F&O segment for financial years 2019 and 2022. The report is surely worth a read to understand the nature and degree of involvement of the average Indian retail across ages and cities in the equities derivatives product. For good order individual trader/investor includes HUF (Hindu undivided family) and Non-resident Indians and excludes prop traders, institutions, partnership firms etc. Here's a quick summary:
Table 3 – PnL comparison FY19 vs FY22
| Metric | All traders FY19 | All traders FY22 | Active FY19 | Active FY22 | Non-active FY19 | Non-active FY22 | Active trimmed FY19 | Active trimmed FY22 |
|---|---|---|---|---|---|---|---|---|
| Total number of individual traders (sample size) | 706,757 | 4,524,841 | 617,652 | 3,976,419 | 89,105 | 548,422 | 555,886 | 3,578,777 |
| % of Total | 100% | 100% | 87% | 88% | 13% | 12% | 79% | 79% |
| % of Loss makers during the year | 85% | 89% | 87% | 90% | 76% | 83% | 91% | 94% |
| Average absolute loss in INR | -175,332 | -111,216 | -194,020 | -124,528 | -12,730 | -6,217 | – | – |
| % of Profit makers during the year | 15% | 11% | 13% | 10% | 24% | 17% | 9% | 6% |
| Average absolute profit in INR | 146,791 | 151,997 | 181,919 | 186,399 | 10,927 | 6,221 | – | – |
Source: SEBI, Pandemonium
Since NSE accounts for the lion's share of options activity (99% of equity derivatives turnover in FY23), let's consider the product suite below (product list isn't exhaustive).
Table 4 – NSE Equity Option Product suite and specifications
| S no. | Index Name | Min Notional (INR)* | Contract type and Trading cycle | Expiry |
|---|---|---|---|---|
| 1 | NIFTY 50 | 500,000 | 4 weekly expiry contracts, 3 consecutive monthly contracts, additionally 3 quarterly months of the March, June, September and December cycle and 8 contracts following semi-annual Jun and Dec cycles. At any point in time there would be option contracts with at least 5 year tenure available. | Monthly contracts last Thursday of expiry month, weekly contracts every Thursday of expiry week |
| 2 | Bank NIFTY | 500,000 | Weekly, Monthly and Quarterly. Monthly contracts have a 3 month trading cycle with every month's expiry replaced with new strikes for both calls and puts for next 3 month trading cycle. Weekly options have weekly expiries excluding the expiry week of the monthly contract. Quarterly contracts have March, Jun, Sep and Dec cycle. | Last Wednesday of the expiry period |
| 3 | NIFTY Financial Services | 500,000 | Weekly and Monthly. 4 trading cycles for weekly contracts excluding the monthly expiry and 3 consecutive months trading cycle with near month, mid month and far month expiries. | Last Tuesday of the expiry period |
| 4 | NIFTY Midcap | 500,000 | – | Last Monday of the expiry period |
| 5 | NIFTY PSE | 200,000 | Monthly contracts with 3 month trading cycle, and near month, mid-month and far month expiries. Every near month expiry replaced with new strike for both call and put for a duration of 3 months. | Last Thursday of the expiry period |
| 6 | NIFTY Infrastructure | 200,000 | – | Last Thursday of the expiry period |
| 7 | NIFTY Next 50 | 500,000 | – | Last Friday of the expiry period |
| 8 | Individual Securities | 500,000 | – | Last Thursday of the expiry period |
| 9 | NIFTY Midcap 50 | 200,000 | – | Last Thursday of the expiry period |
Above mentioned figures are the minimum notional at the time of introduction. The permitted lot size for futures contracts & options contracts shall be the same for a given underlying or such lot size as may be stipulated by the Exchange from time to time. Source: National Stock Exchange, Pandemonium
These are options that expire within 24 hours or at the end of the current trading day, having decayed almost fully as they approach expiry and hence those without intrinsic value are very cheap to buy. But it's important to remember that options closer to at the money and approaching expiry are also closer to their peak gamma i.e. option value is extremely sensitive to the slightest move in the underlying's price. In case needed you can refer to option greeks in Pandemonium's options and strategies section for a refresher. Sudden spikes or troughs in the cash price of the underlying can result in exponential gains for those who have built a long gamma exposure. Here is why traders would engage in these options:
Recent onshore anecdotal evidence/research suggests largely speculative trading activity from retail in equity options with 'average holding period of less than 30 mins'. Expiry day volumes across the more actively traded indices (Nifty 50, Bank Nifty, Fin Nifty, Sensex) are all well above 50% of the total week's volume suggesting the craze for ODTE. Another way of validating this is to note that end of day open interest is a much smaller fraction, sometimes low single digit percentage of the day trading volume.
Now keeping this market construct as our backdrop, let's think of scenarios that can potentially expose the risk vulnerabilities of certain segments of the market. Severely deficient cash market liquidity versus options liquidity can create incentives for disproportionately high pay-offs at the cost of temporary disorderly market moves.
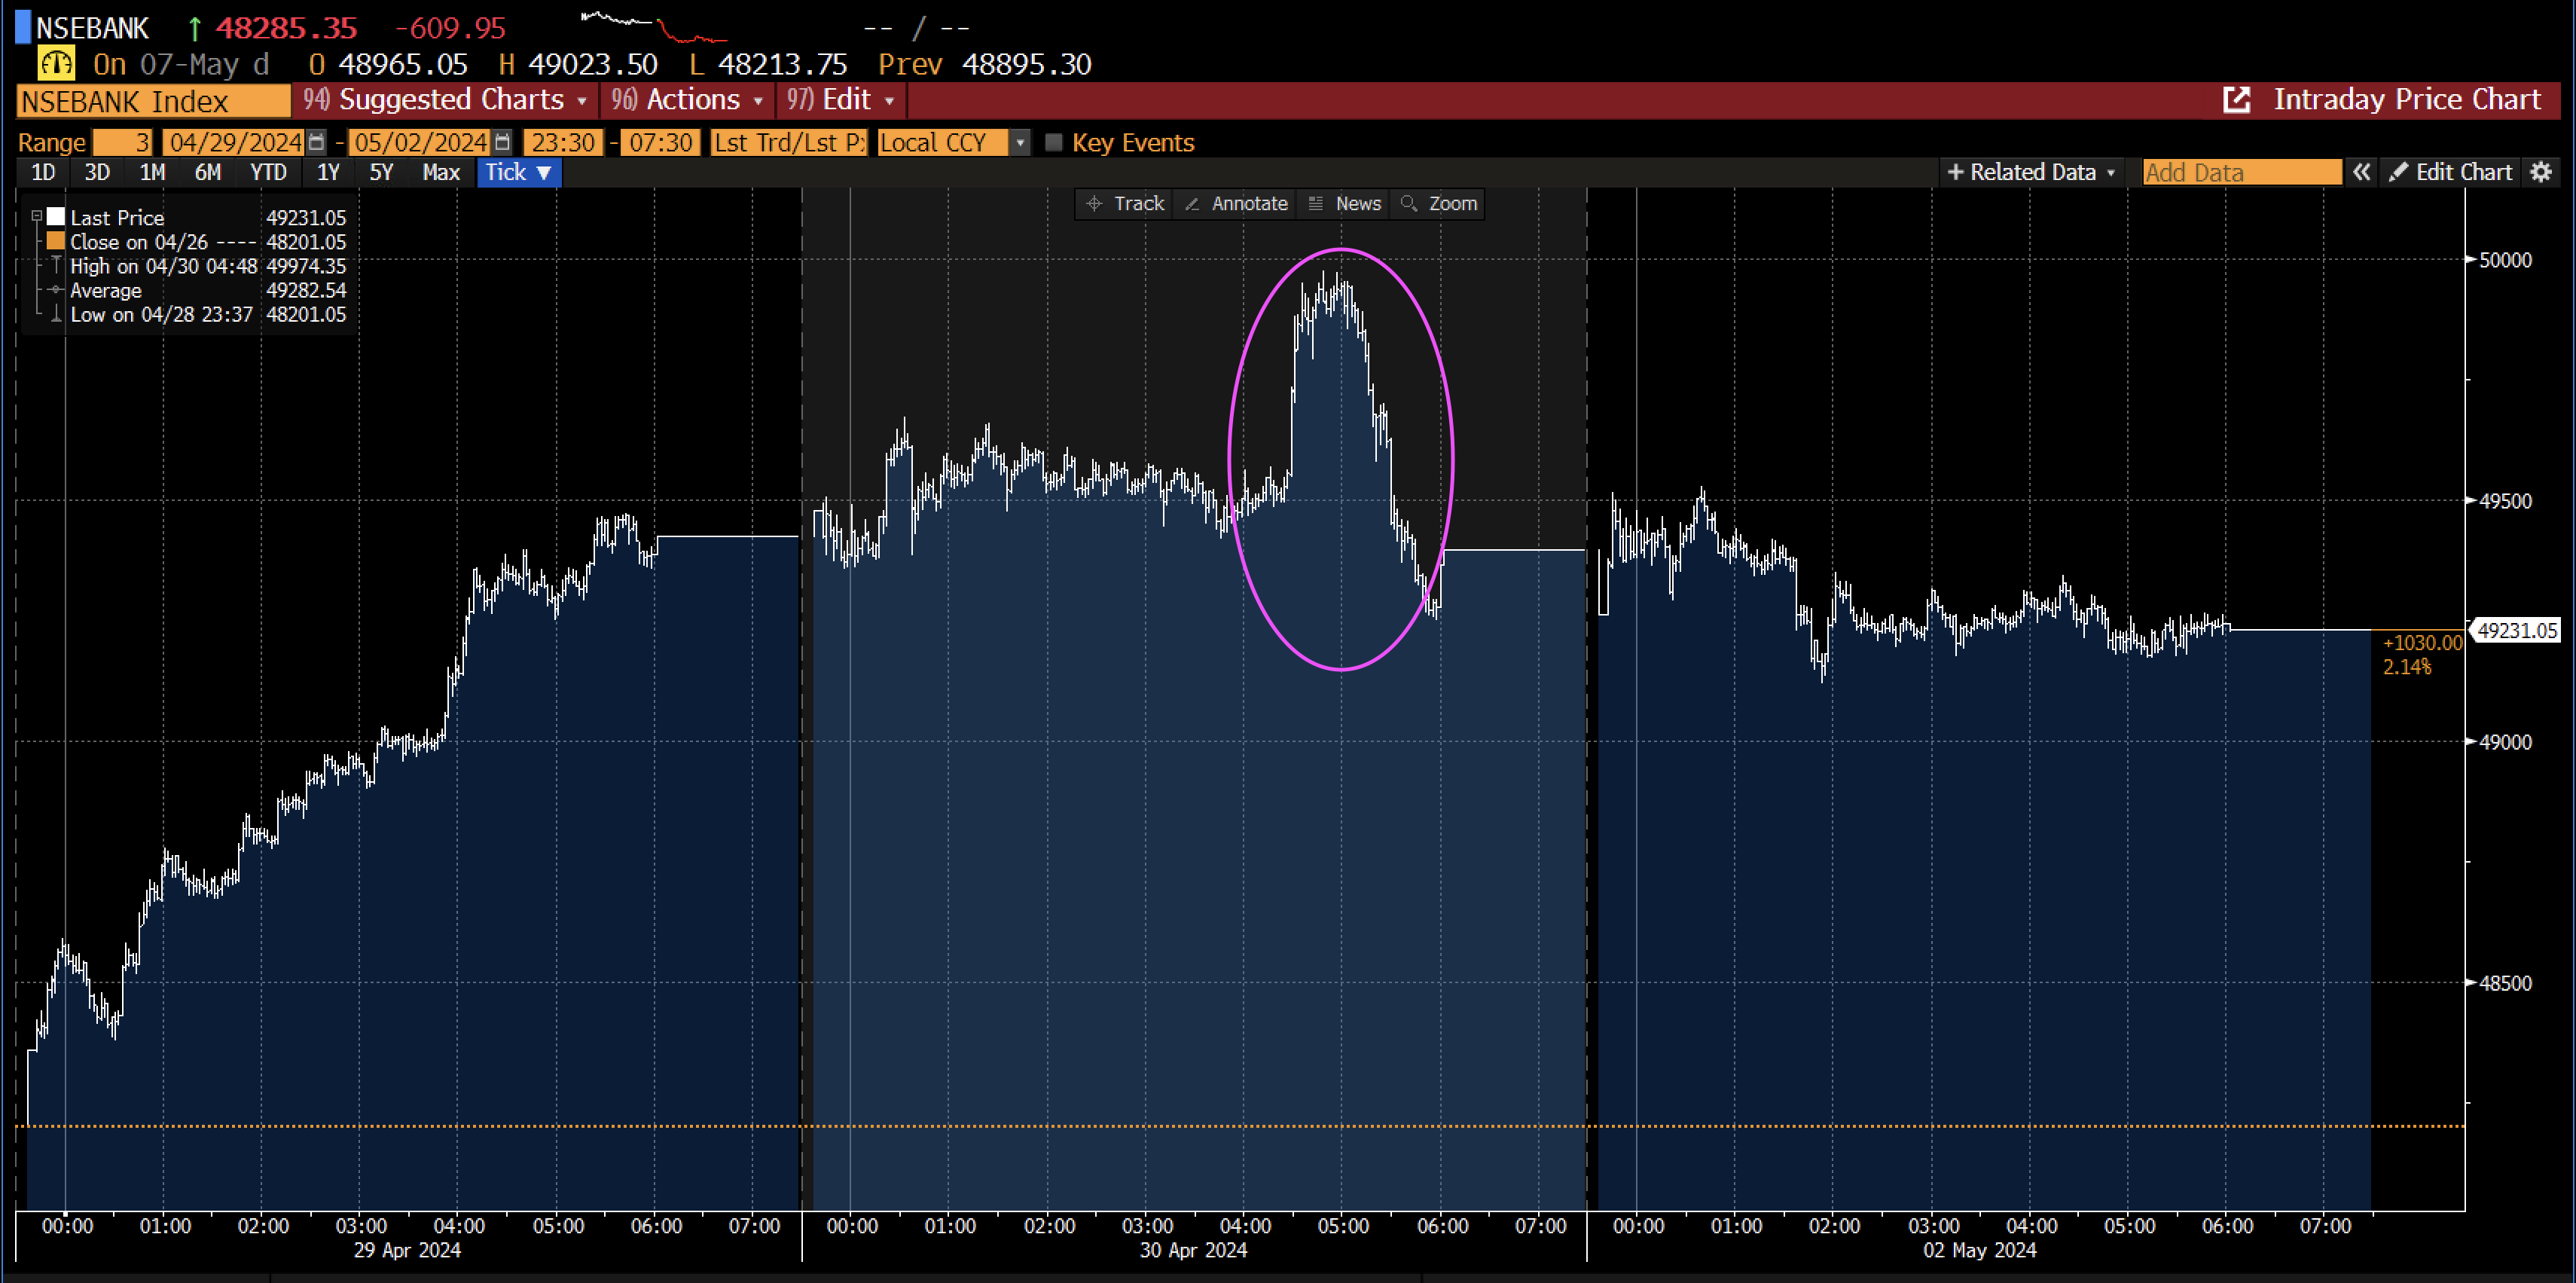
Below is a Bloomberg snapshot of the intra-day price action – closer to 2 pm IST in a span of less than two hours the Bank Nifty Index first jumps 1% in the first 30 mins and then tanks about 1.4% from that peak in the next hour or so – that's a full range of nearly 1200 index points up and down on effectively no news.
Chart 5 – Expiry day NSE Bank Nifty Intra-day price action
Source: Bloomberg, Pandemonium
Intra-day price action in the corresponding ODTE European Calls and Puts (sourced from NSE's end of day Bhav Copy for April 30th) with near at the money strikes also shows a similar pattern within a similar time window. For instance, the call option prices near ATM/slightly OTM strikes shot up from 500-2500% (depending on their moneyness) as against a 1% upmove in the underlying in a span of 30 mins. On the down-move thereafter with expiry still closer, the put option prices near ATM/slightly OTM strikes jumped ~1000-10,000% (depending on their moneyness) as against a 1.4% decline in the underlying, in less than 60 mins! At the cost of repeating myself – liquidity is highest for ATM and closer strikes and so is the option's gamma to realise exponential gains. Alongside option sellers astounded by an exploding gamma-hedging bill for these strikes struggle to exit their positions at the eleventh hour crystalising huge losses.
Table 5 – Snapshot of NSE's Bhav Copy as of April 30, 2024
| FinInstrmNm | TckrSymb | XpryDt | StrkPric | OptnTp | PrvsClsgPric | OpnPric | HghPric | LwPric | ClsPric | SttlmPric |
|---|---|---|---|---|---|---|---|---|---|---|
| OPTIDX | BANKNIFTY | 30-Apr-24 | 49400 | CE | 223.5 | 221 | 630.5 | 0.05 | 22.25 | 49396.75 |
| OPTIDX | BANKNIFTY | 30-Apr-24 | 49700 | CE | 82.5 | 85.05 | 356.2 | 0.1 | 3.65 | 49396.75 |
| OPTIDX | BANKNIFTY | 30-Apr-24 | 50000 | CE | 29.75 | 24 | 143.9 | 0.1 | 0.9 | 49396.75 |
| OPTIDX | BANKNIFTY | 30-Apr-24 | 49400 | PE | 145.25 | 128.6 | 169 | 1.2 | 6.75 | 49396.75 |
| OPTIDX | BANKNIFTY | 30-Apr-24 | 49700 | PE | 303.6 | 310.45 | 378 | 15.5 | 215.2 | 49396.75 |
| OPTIDX | BANKNIFTY | 30-Apr-24 | 50000 | PE | 552.65 | 500 | 646.4 | 75 | 522.6 | 49396.75 |
Source: NSE, Pandemonium
The sheer enormity of the equity derivatives market would make it challenging to track for disorderly price action especially sometimes in the presence of several moving parts both locally and globally. But to sustain a healthy operation and vibrance of these markets it may be worth observing some of these price movements with a fine tooth comb. SEBI and the exchanges have so far been proactive and amazingly enterprising in the development of the derivatives product addressing potential risks as and when necessary. I'm sure there's no reason for us to doubt that spirit going forward.