With Powell ruling out hikes and Q1 earnings strong, financial conditions have eased into a carry-friendly sweet spot. This piece maps the macro backdrop, the vol-selling regime and payer-spread trades to position for an eventual inflation shock.
The short version
Varda Pandey
Author
May 21, 2024
LISTEN · NARRATED
0:00
0:00
1x
Login to Listen
A system in need of shock therapy, would likely chug along with retail therapy!
Risk Assets seem to have found a 'sweet' equilibrium in sync with a 3-3.5% headline inflation steadily adding to US households' networth. A very eloquent chair Powell, calling a rate hike 'unlikely', kept up the narrative for rate cuts at some point in the future despite the eroding confidence in inflation trajectory sustainably heading towards 2%. Add to this an impressive first quarter of earnings for S&P 500 companies reinforcing easier financial conditions and vice versa, and you likely get strong tailwinds to GDP growth in the coming quarters alongside still robust consumer demand. A recent GS report estimates these growth tailwinds of about 30-40bps each for the next two quarters; street estimates ranging from 3-3.5% y-o-y growth in Q2 versus 1.6% in Q1.
As for inflation, adverse base effects ahead can only be offset by 10-15bps monthly increments in Core PCE to confidently converge to Fed's 2% target towards the end of the year. Doesn't take an expert forecaster to conclude that's a tall order in the current backdrop. Before we conclude our macro framework (request you to read this piece as a continuation to the pre-FOMC piece) here are some noteworthy observations of the past couple of weeks:
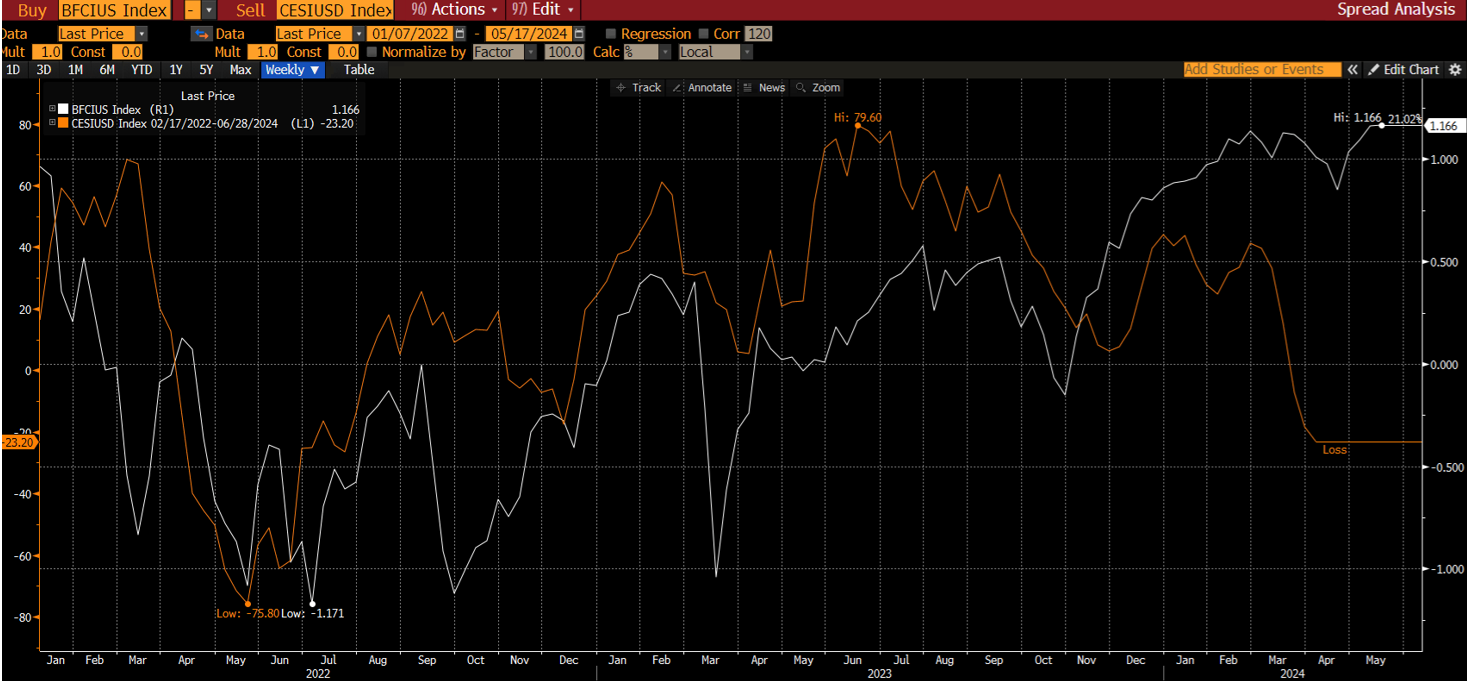
Negative surprises on macro data are deceptive – US Fed has blessed markets with longer periods of easy financial conditions followed by short bouts of tightness, short enough to be followed by easier conditions again. Periods of strength in risk assets that boost consumer and business sentiment also drive forecasts for follow-on macro data higher. Actual prints are likely to be below forecasts in this case, which doesn't necessarily imply weaker growth conditions. In fact as per the picture below the Economic Surprise index may soon head back into positive if financial conditions remain easy.
Chart 1 – Bloomberg US Financial Conditions (white line) leads the Citi Economic Surprise Index (orange line) by 6-7 weeks
Source: Bloomberg
Consumer balance sheets update – Bloomberg has had excellent coverage on some of the US macro nuances – chart below shows a steady trajectory for consumer spend on services, with goods prices deflation likely saving enough for demand for services (and its prices) to remain sticky longer than one can imagine. Weak April retail sales that exclude the crucial services component of spending (the index represents less than half of personal consumption basket) isn't a great indicator of consumer health. And lastly, the popular notion of consumers having run down their pandemic-era excess savings should still be qualified with their excess cash to nominal GDP ratio at 60% being 3 percentage points higher than the pre-pandemic trend. That's an excess of USD 850 bio in nominal terms.
Chart 2 – Households spending on services remains well intact
Source: Bloomberg
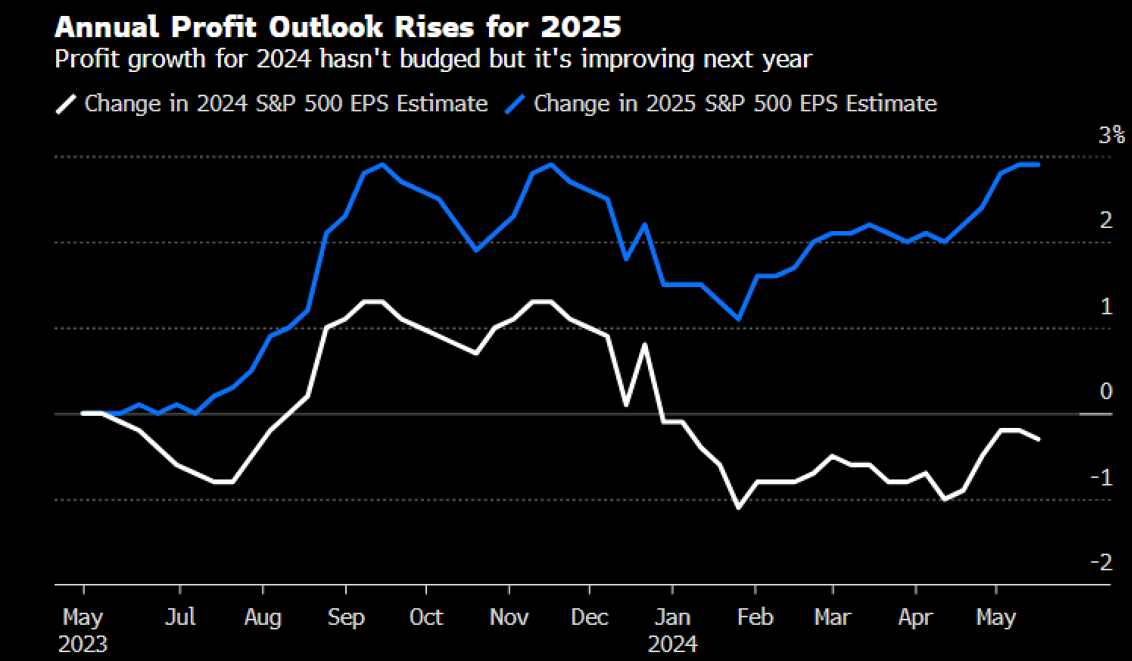
Corporate earnings update – NVIDIA is the last of the magnificent seven due to report results this week, but with 90% of S&P 500 companies having reported earnings we are at Q1 EPS growth of 7.3%, nearly double of what was forecasted. Broader anecdotal evidence on profitability suggests optimism citing that the worst of last year's profit hurdles seem to be behind us. Excluding Mag 7, profitability growth of rest of the index is estimated to flip into positive (from current -1.4%) from Q2. Even a steady grind higher in yields and the first (adjustment) rate cut as far as Q4 of this year can likely be accommodated by corporate balance sheets and sustain improvement in forward profit margins.
Chart 3 – S&P earnings per share estimates
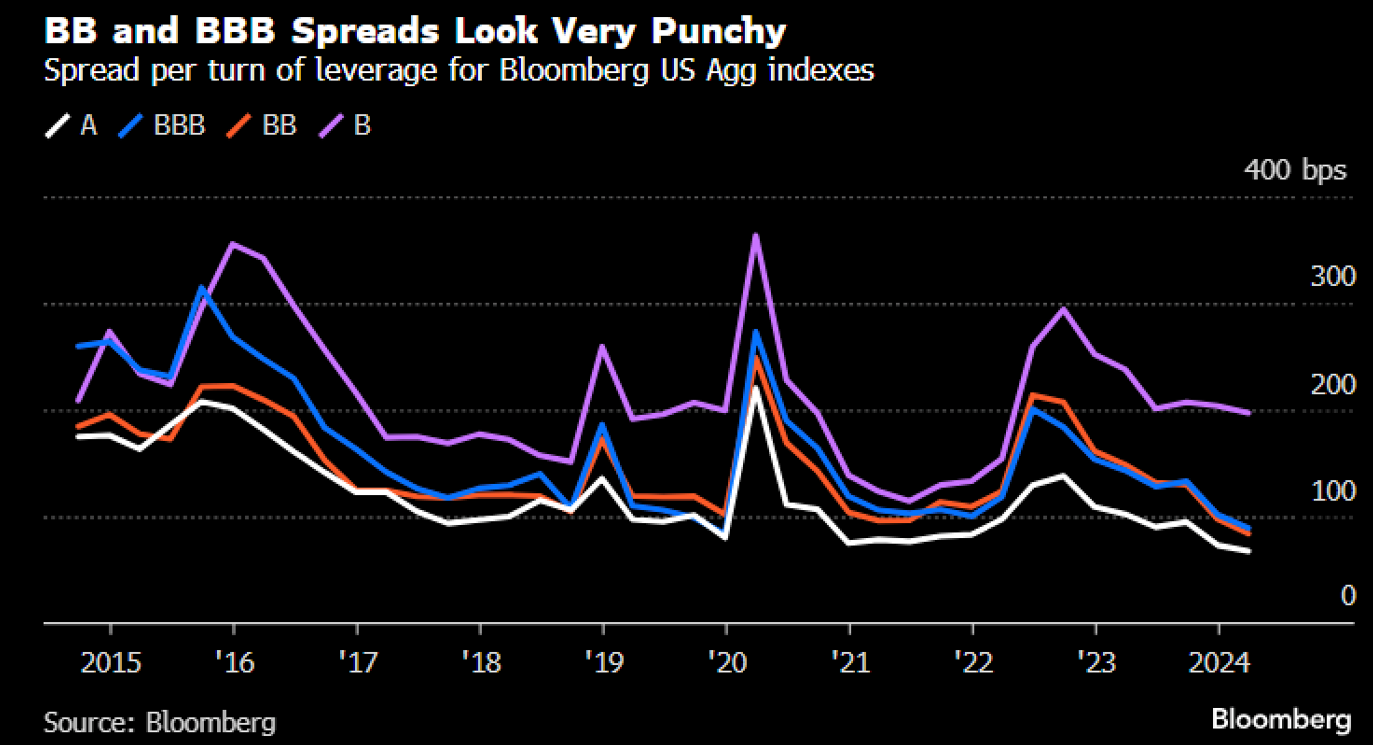
Credit Spreads per turn of leverage making fresh lows – Squeezing credit spreads shouldn't be blamed for potential mispricing of risk when easier financial conditions have been ordered by the Fed and easy access to financing can now be validated by the expected improvements in margins. Quoting a Bloomberg analysis here:
The spread per turn of leverage for single-A borrowers was at a historical low at the end of the first quarter (and has fallen since). But it's BBBs and BBs that really stand out. For BBB bonds, the spread per turn of leverage (SPL) was the lowest since 4Q, 2019. For BBs it's the lowest in a decade. Single-B borrowers, on the other hand, don't look particularly expensive.
Chart 4 – Credit Spreads per turn of leverage
To clarify the jargon, SPL is typically computed as average (rating specific) spread divided by the median net Debt to EBITDA ratio (understood as leverage) for that rating cohort. Net leverage has been stable for ratings above junk, while for Junk ratings it's been falling.
Forget signaling a recession, yield curve inversion has contributed to easier financial conditions by adding to the free cash flows of tech companies (via 5% plus interest income earnings on money market instruments) enabling large dividend payments/share buybacks.
Long duration bets building up + vol selling continues – after the last CPI print that was cheered big for core being 'in-line' with economist estimates for the first time this year, markets luckily found itself in a Goldilocks backdrop bracing for long carry trades:
Asset Managers built long positions in Treasury futures for the 5th straight week as per CFTC (they still remain underweight), with Hedge funds taking the other side
Short USD Asia (dollar surplus currencies like KRW, TWD and positive carry INR with potential tailwind from another large mandate for the current government),
Turnaround in EM Bonds outflows with recent sizeable inflows to high yielders Turkey and South Africa, and some into India
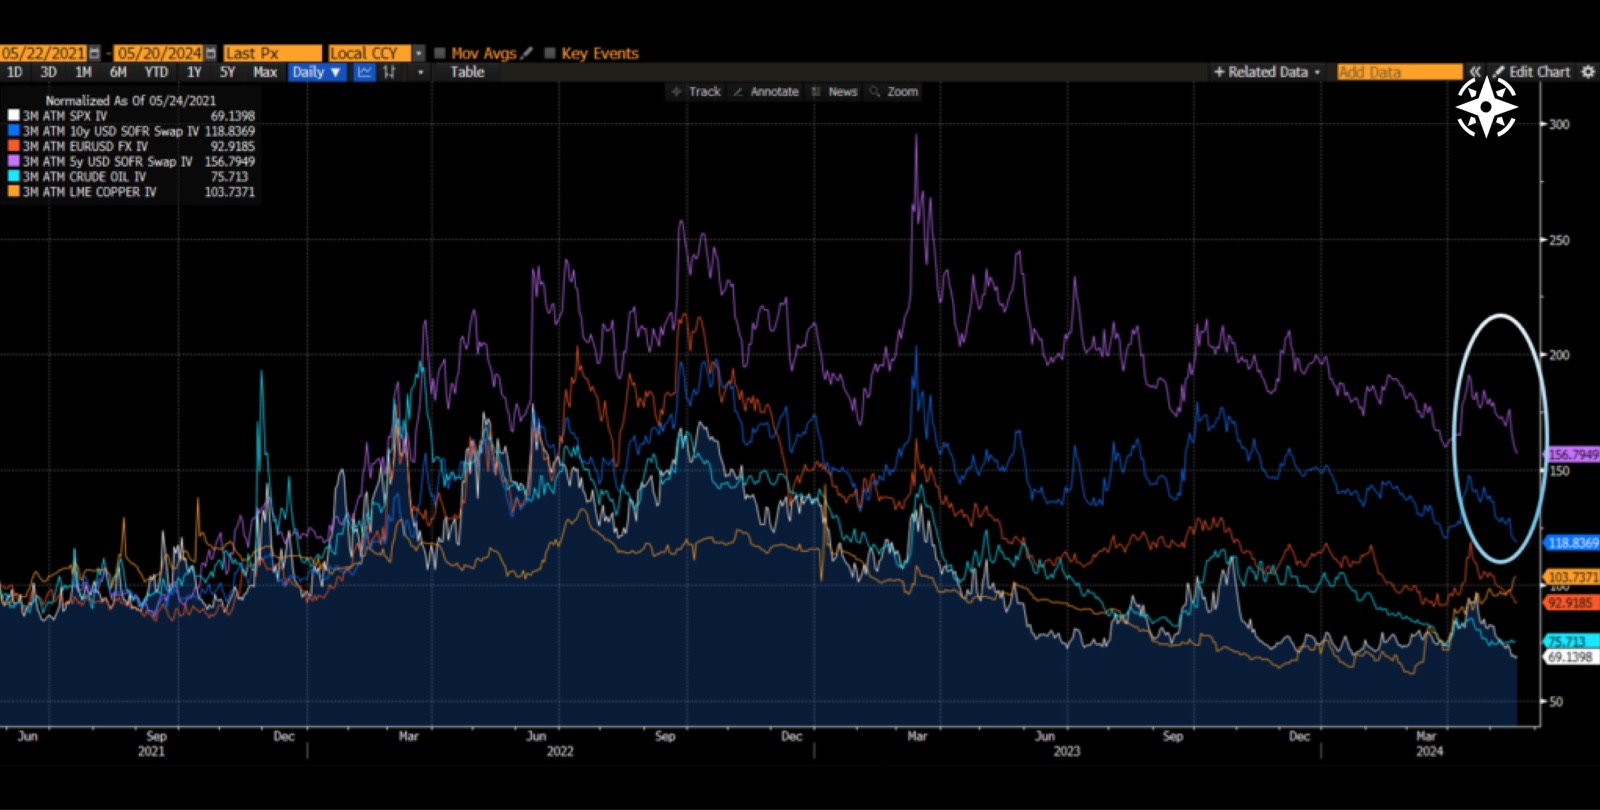
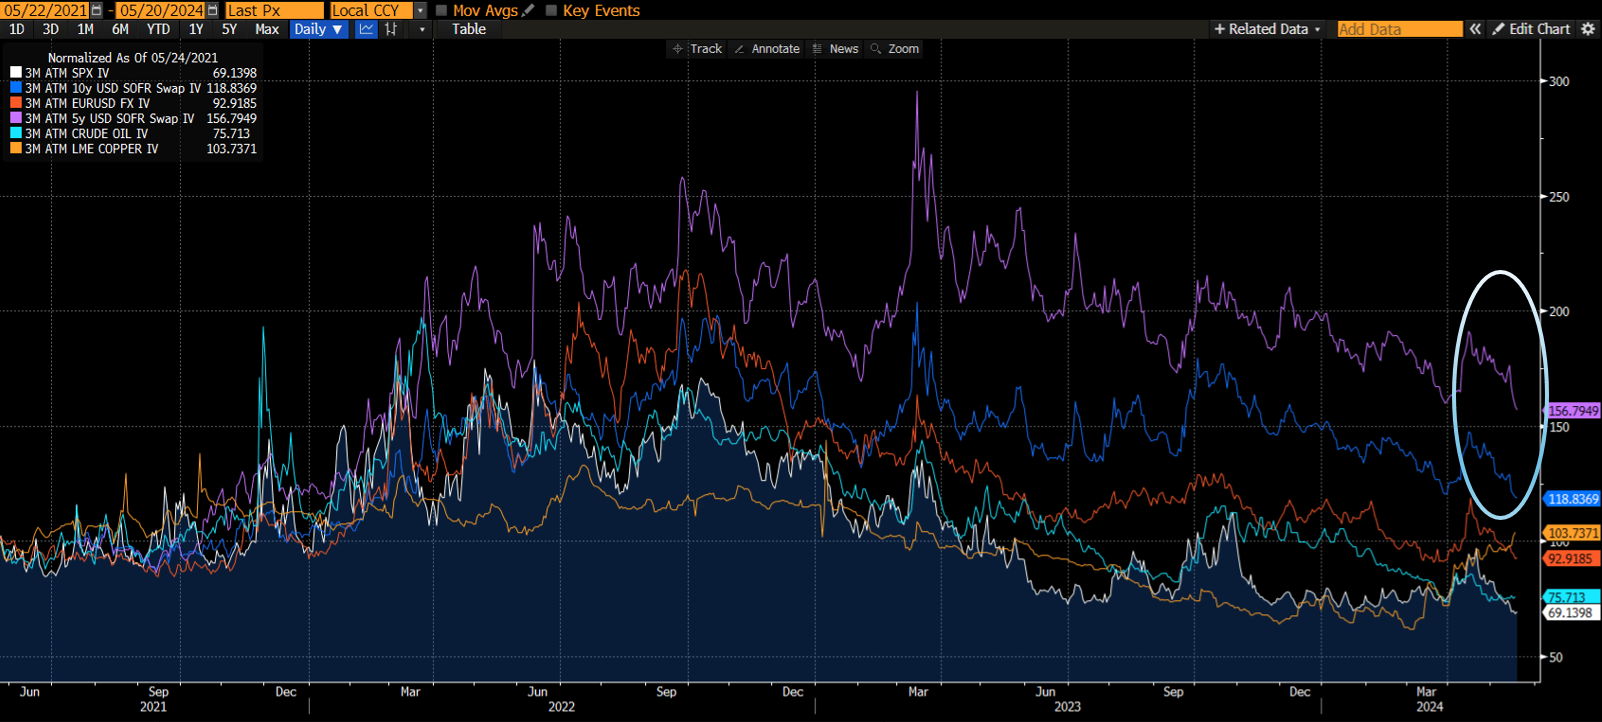
Cross Asset Vol and the bias to short optionality – below is a snapshot of 3m at the money implied vols across assets, barring the breakout moves in copper (and gold) rest of the spectrum has been heading lower. In absolute terms, implied vols for rates are the highest and given the Fed-induced support for carry, selling of rates volatility has continued. Intuitively speaking, premium income on selling vol is akin to carry income assuming no change/move lower in the underlying's realized volatility. Recommendations on going long assets with embedded call and prepayment options (mortgage-backed securities) amid spikes in underlying's vol remain popular.
Chart 5 – 3m ATM implied volatility across assets (normalized to a factor of 100)
Source: Bloomberg
Should we prepare for a shock? – if Fed's 2% target is the central premise for keeping monetary policy restrictive then there's ample evidence that we aren't restrictive enough. But since that rhetoric goes against all Fedspeak (i.e. another hike officially ruled out) for now, any inflation-induced adjustment higher in yields is likely to happen in a breakout fashion. If the Fed doesn't want to engineer a shock, easier financial conditions may bring us to position for one.
Payer spreads on USD SOFR swaps – with no talks of 5%+ back-end treasury yields in the current backdrop and a much slower Fed balance sheet run-off, one can position for a 5%+ yield outcome towards the end of the year. Larger than expected monthly inflation prints as we approach the last quarter, and a growing likelihood of a Trump presidency should be enough for a 50-70bps sell-off in bonds. A 6m expiry 4.30/4.80, 1×1 payer spread on 10y USD SOFR swap costs about 10bps running for a max gain of 50bps. That's 4x leverage to position for events with more than even odds.
To conclude, current range on yields are aligned with 1 to 2.5 cuts by the end of the year. I have personally liked being short the long end rates as a core view but being mindful of stretched paid exposure of CTAs has also been important to crystalise gains and build over at better levels. More neutral/cleaner positioning can allow for some leverage on your expressions – for instance being short 5y5y instead of 10y. Steepeners on the swap curve (forward starting 2×10, 5×30) have been reinstated after Fed's reassurance on current conditions being restrictive enough – but even with rate hikes being ruled out, the pattern of bear flattening and bull steepening would be hard to break.
Current range feels like 4.30-4.55 on 10y UST, with next litmus test coming from April personal spending data and Core PCE scheduled to release end of this month.